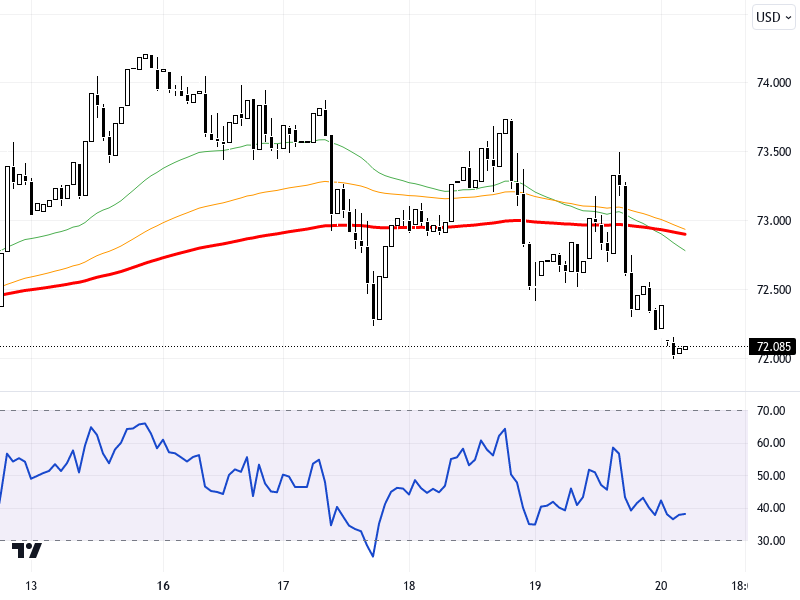
BRNUSD
Oil prices remained under pressure due to the strengthening dollar following the Fed, expectations of low demand from China, and predictions of increased production outside of OPEC+. Global markets are closely monitoring the cautious course of Asian indices and the upcoming PCE inflation data from the U.S. The inflation data from Japan signals possible changes in the BoJ's interest rate policy. Meanwhile, U.S. indices are moving sideways, and the U.S. 10-year Treasury yields are at high levels.
From a technical perspective, when the BRNUSD chart is analyzed on an hourly timeframe, a downward trend might be prominent as long as the price remains below the resistance levels of 72.40 - 72.75. In potential pullbacks, the support levels of 71.50 and 71.00 might be targeted. The RSI indicator is at 40, showing a negative outlook. In the pair, which declined by 0.43% compared to the previous day, if there are upward movements, the levels of 73.00 and 73.30 may come into focus if the resistance zone of 72.40 - 72.75 is surpassed.
Support :
Resistance :


