NGCUSD
U.S. natural gas futures began the week with an increase due to the rise in heating demand but then fell below the week’s opening levels under pressure from rising production and balanced export demand. The performance of European and U.S. stock markets is expected to influence intra-day pricing. Additionally, ISM services PMI and JOLTS job openings data in the U.S. exceeding market expectations strengthened the dollar and heightened expectations regarding the fight against inflation. Key developments of the day include the ADP private sector employment data and the FOMC meeting minutes.
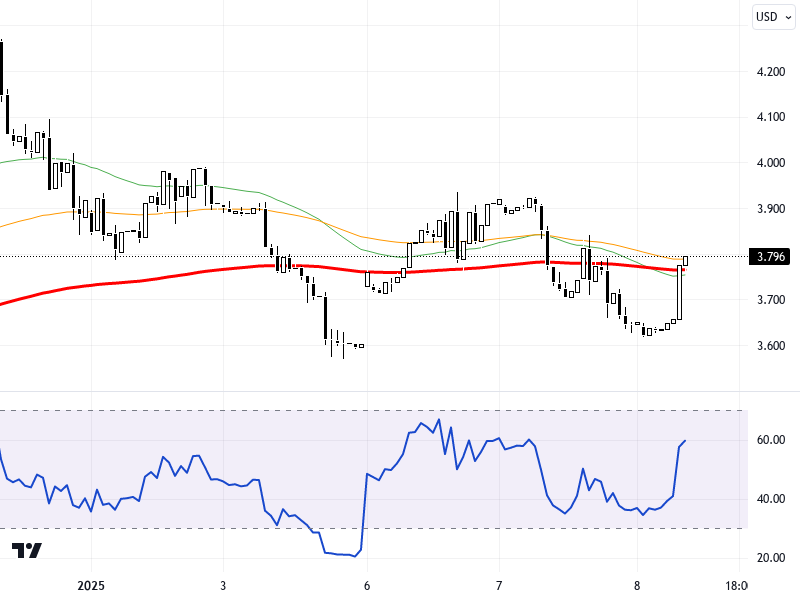
From a technical perspective, the NGCUSD pair is trading below the resistance levels of 3.52 and 3.57 on the daily chart. If these levels are broken, a move towards the 3.62 resistance level can be observed. In downward movements, the support levels of 3.4, 3.36, and 3.33 can be monitored. The RSI indicator is at the 60 level, displaying a positive outlook. Compared to the previous day, the pair increased by 4.00%, which can be considered as a signal of upward momentum.
Support :
Resistance :


