NGCUSD
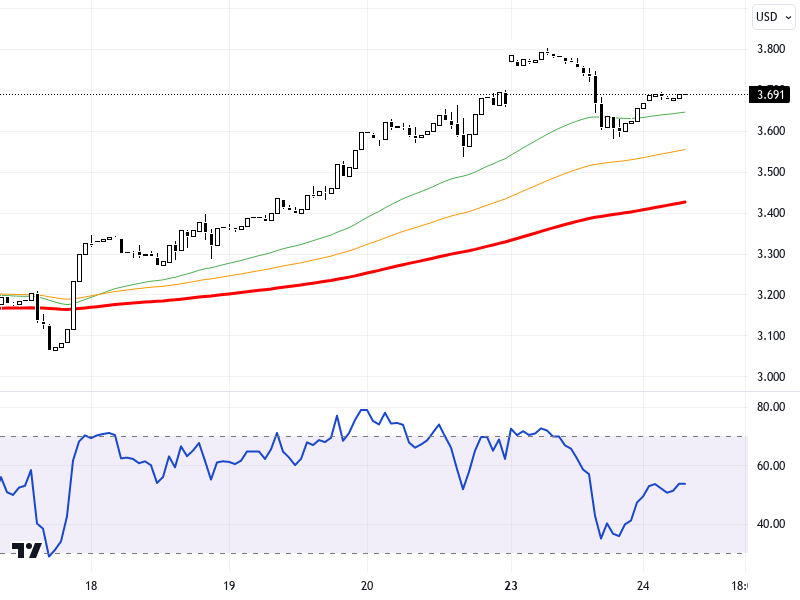
U.S. natural gas futures are in a recovery trend after experiencing profit-taking due to moderate global demand. Some of the losses during the Asian session have been reclaimed, and the heating demand in the U.S., expected to rise until mid-January, is also supporting prices. During this process, the trend of European and U.S. stock markets is among the key factors that could affect natural gas prices. The positive market expectations in the U.S. and the trend of bond yields continue to be monitored for their impact on natural gas demand.
From a technical perspective, the NGCUSD pair is observed on the hourly chart. Prices are maintaining above the support levels of 3.37 and 3.33, presenting a positive outlook for the continuation of upward movement. As long as these levels are maintained, the resistance levels of 3.43 and 3.47 can be targeted. In the event of a downward movement, the levels of 3.33 and 3.295 should be monitored as significant support zones. The RSI indicator is at 65, presenting a positive outlook. Compared to the previous day, the change of +0.65% indicates an upward momentum.
Support :
Resistance :


