EURUSD
Daily NewsletterEURUSD parity accelerated its rise with the PPI data announced yesterday. It continued to increase its speed on the 4-hour chart. Strong upward momentum will...
Read More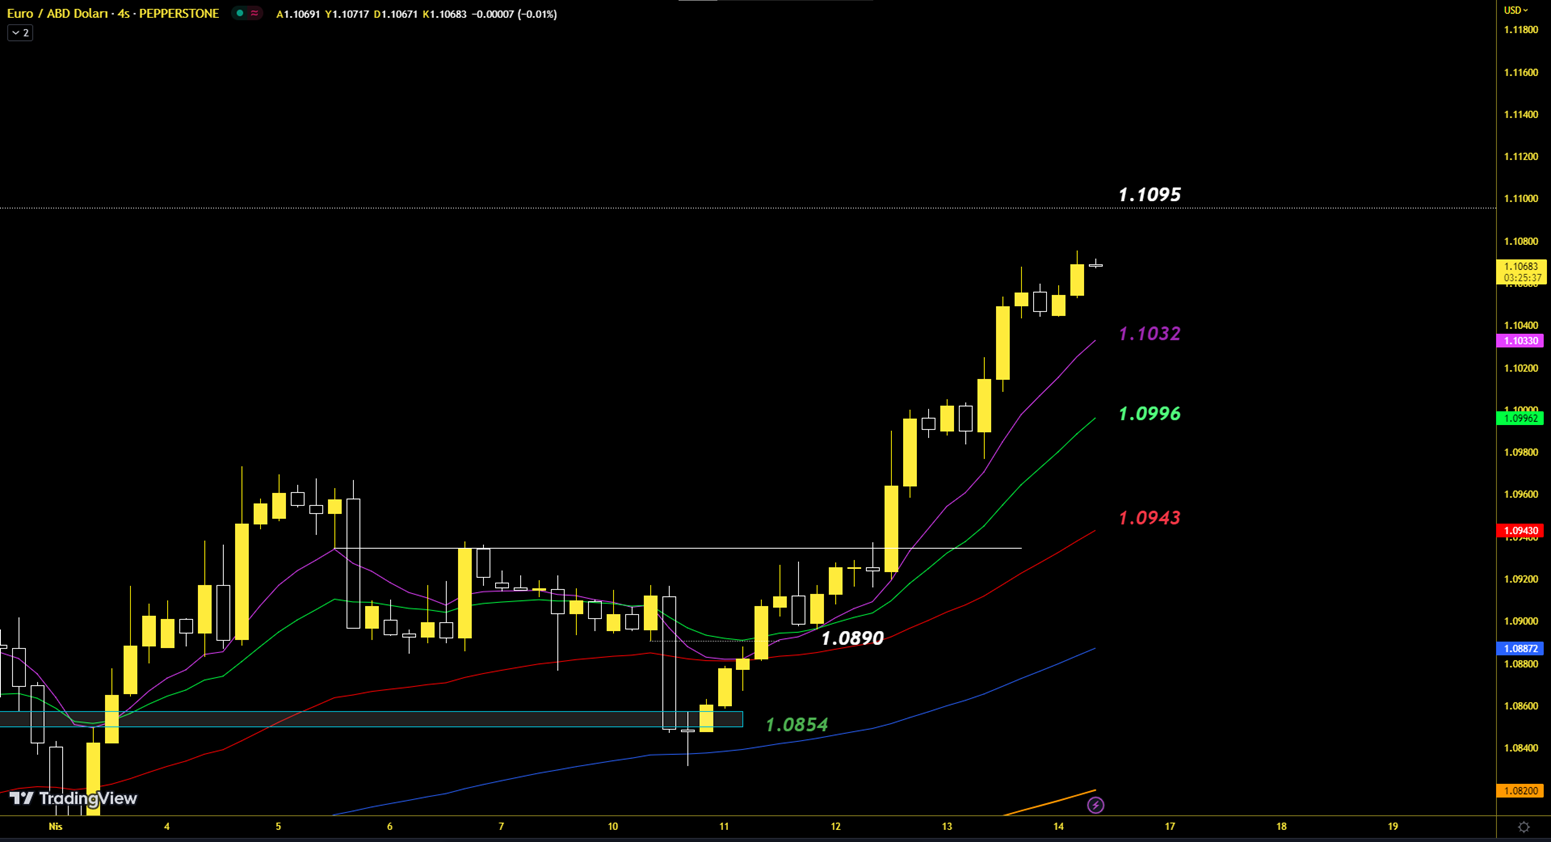
EURUSD parity accelerated its rise with the PPI data announced yesterday. It continued to increase its speed on the 4-hour chart. Strong upward momentum will...
Read More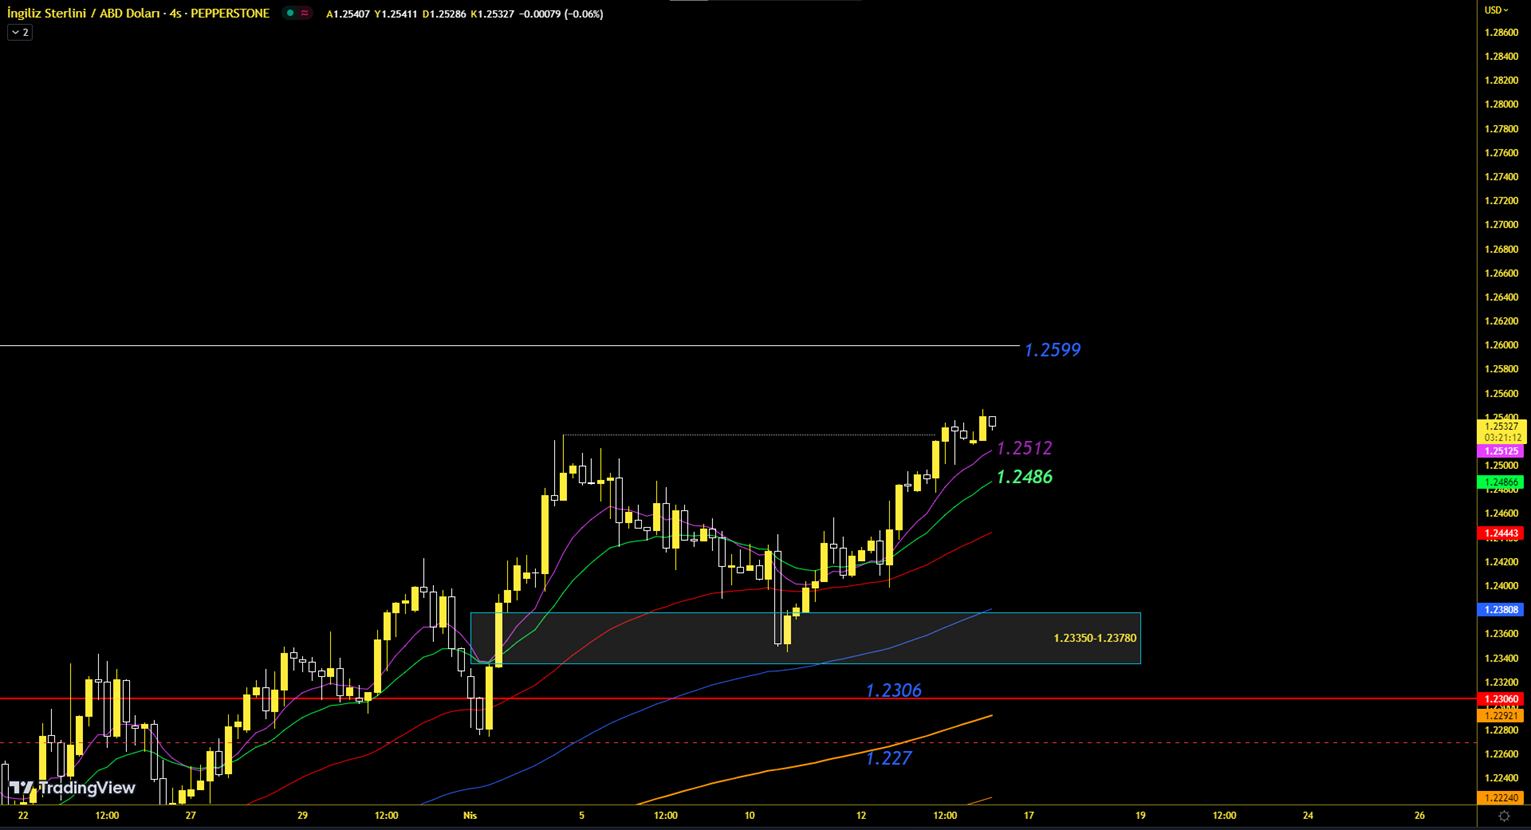
GBPUSD pair increased its upward momentum together with PPI. It passed the peak in its recent past. It continues to advance on the 4-hour moving averages. T...
Read More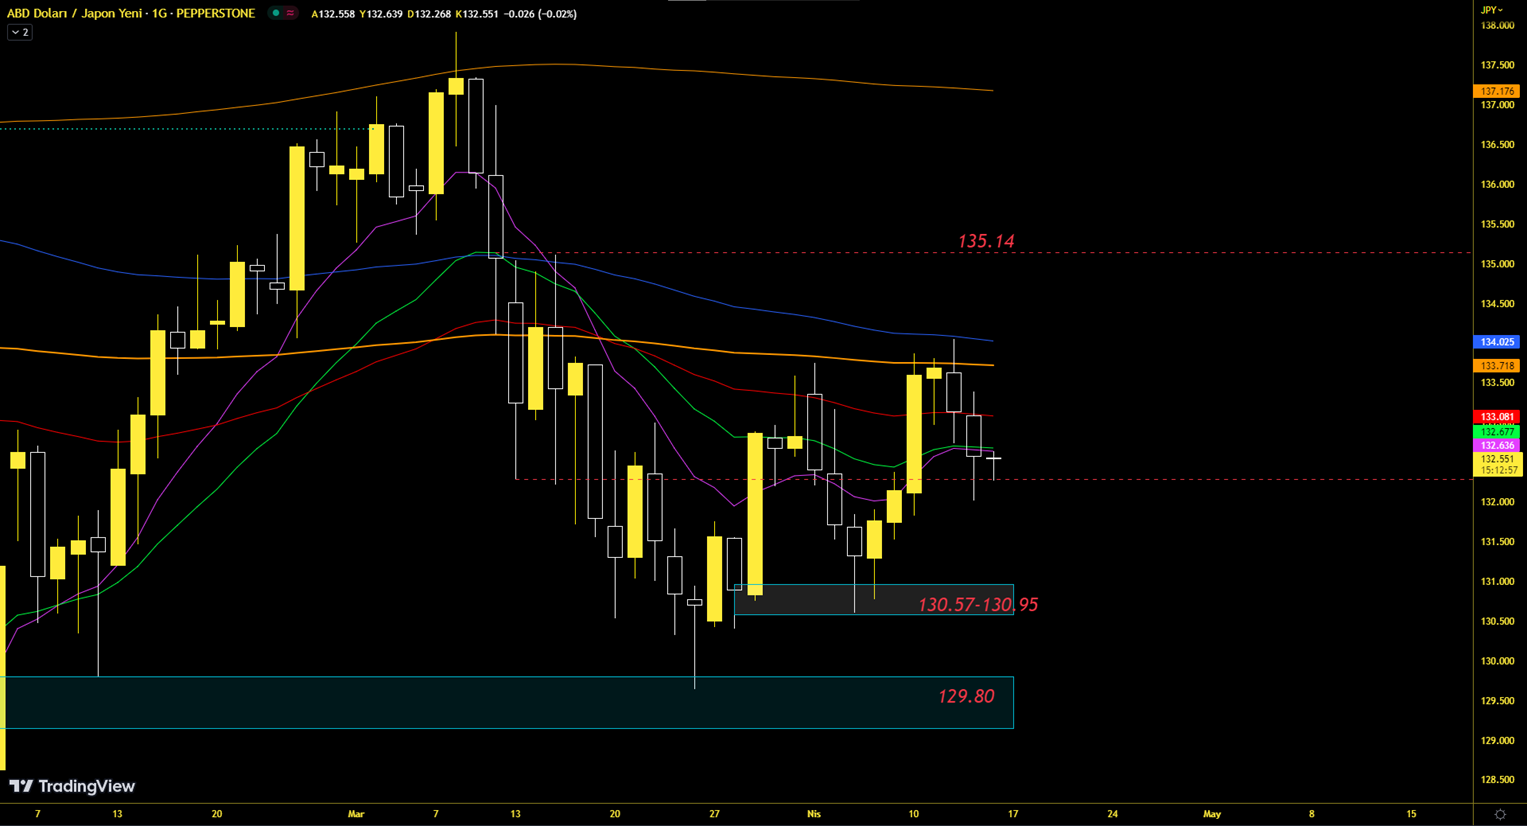
USDJPY The resistance zone that we warned about had a serious impact on the price and caused a pullback. 132.76 EMA20 support is visible. Strong resistances ...
Read More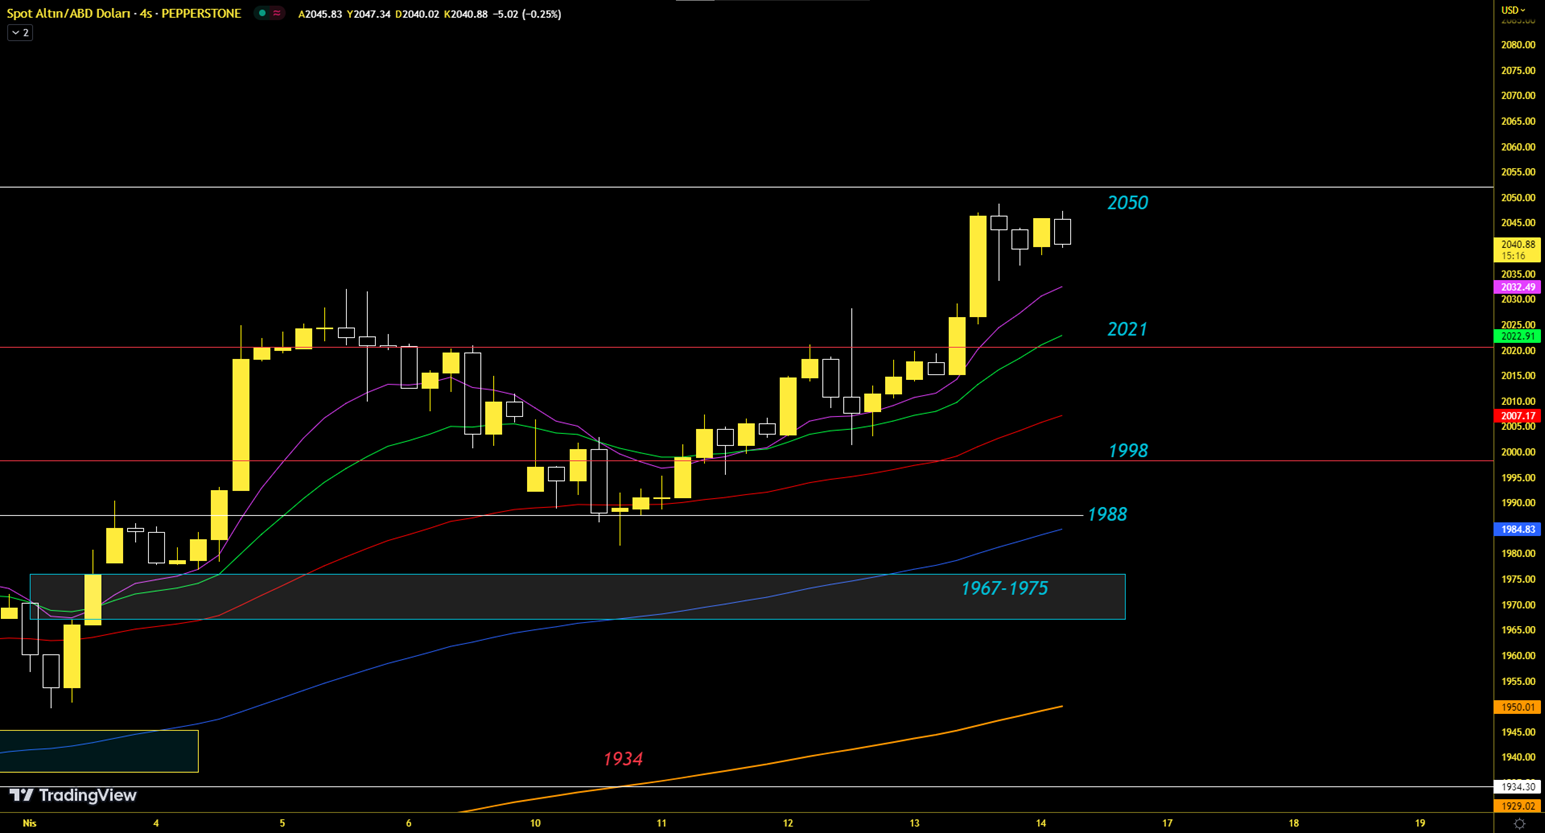
On the ounce gold side, the upper level we pointed out was roughly $2050. Yesterday, the $2049 level was tested after the PPI and this target was achieved. A...
Read More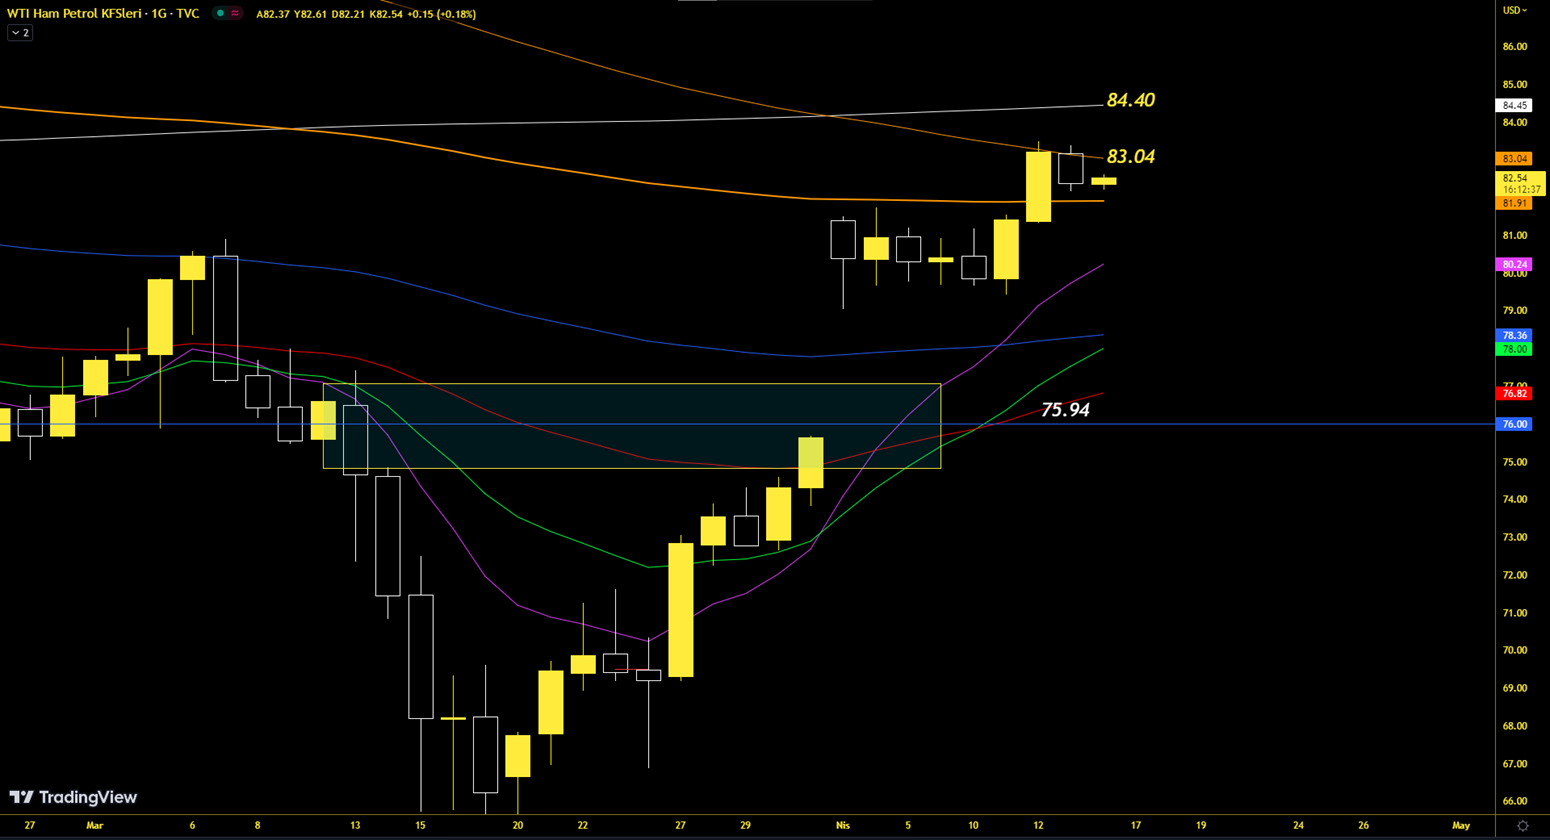
WTI The stable hold on the CRUDE Oil side and the gap not being closed on the lower side caused an upward movement. The price advanced to the center of the re...
Read More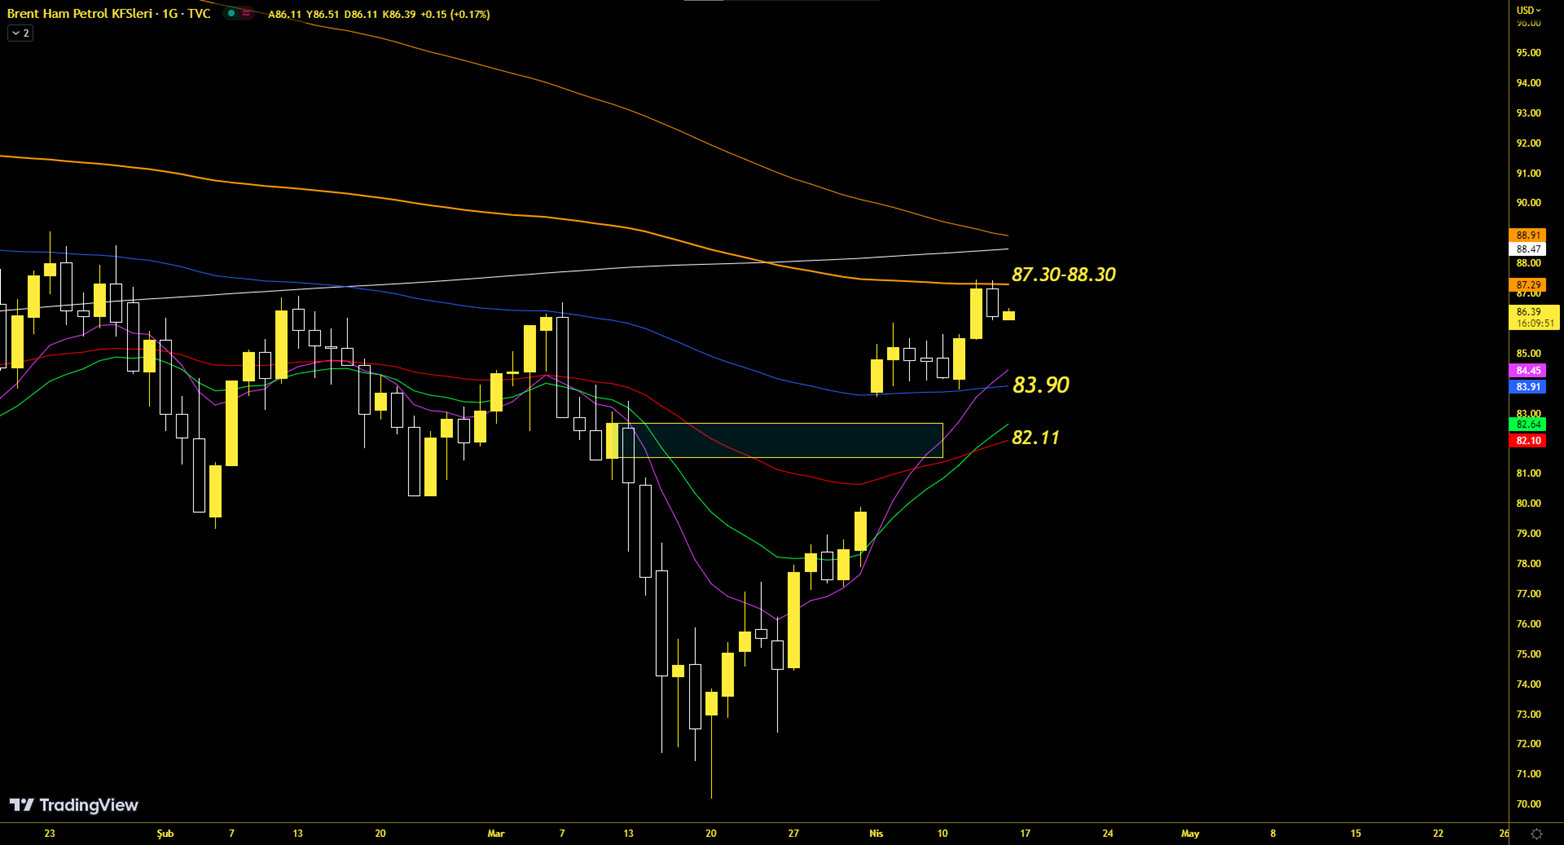
BRENT On the oil side, a daily hold above EMA100 was achieved and then a bullish engulfing candlestick form was produced. This gave us the signal that the pri...
Read More
Nasdaq The series recovered along with PPI. It made a sharp turn around the EMA20 average on the daily. This momentum showed us that the probability of the r...
Read More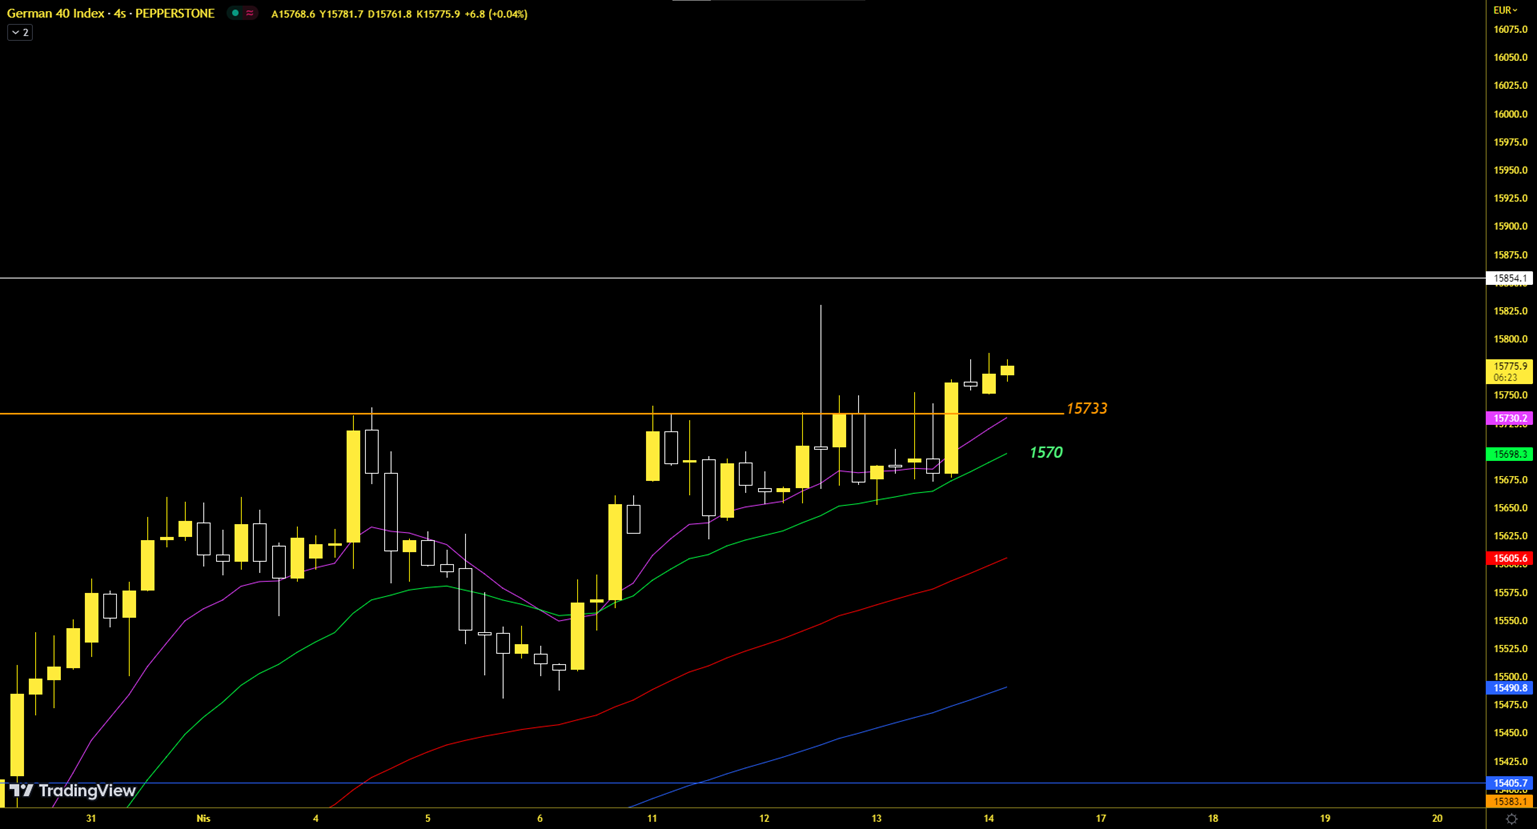
DAX continues to move above moving averages. We have not closed below the 4-hour EMA10 and EMA20 averages yet. The 15733 resistance was also overcome and clos...
Read More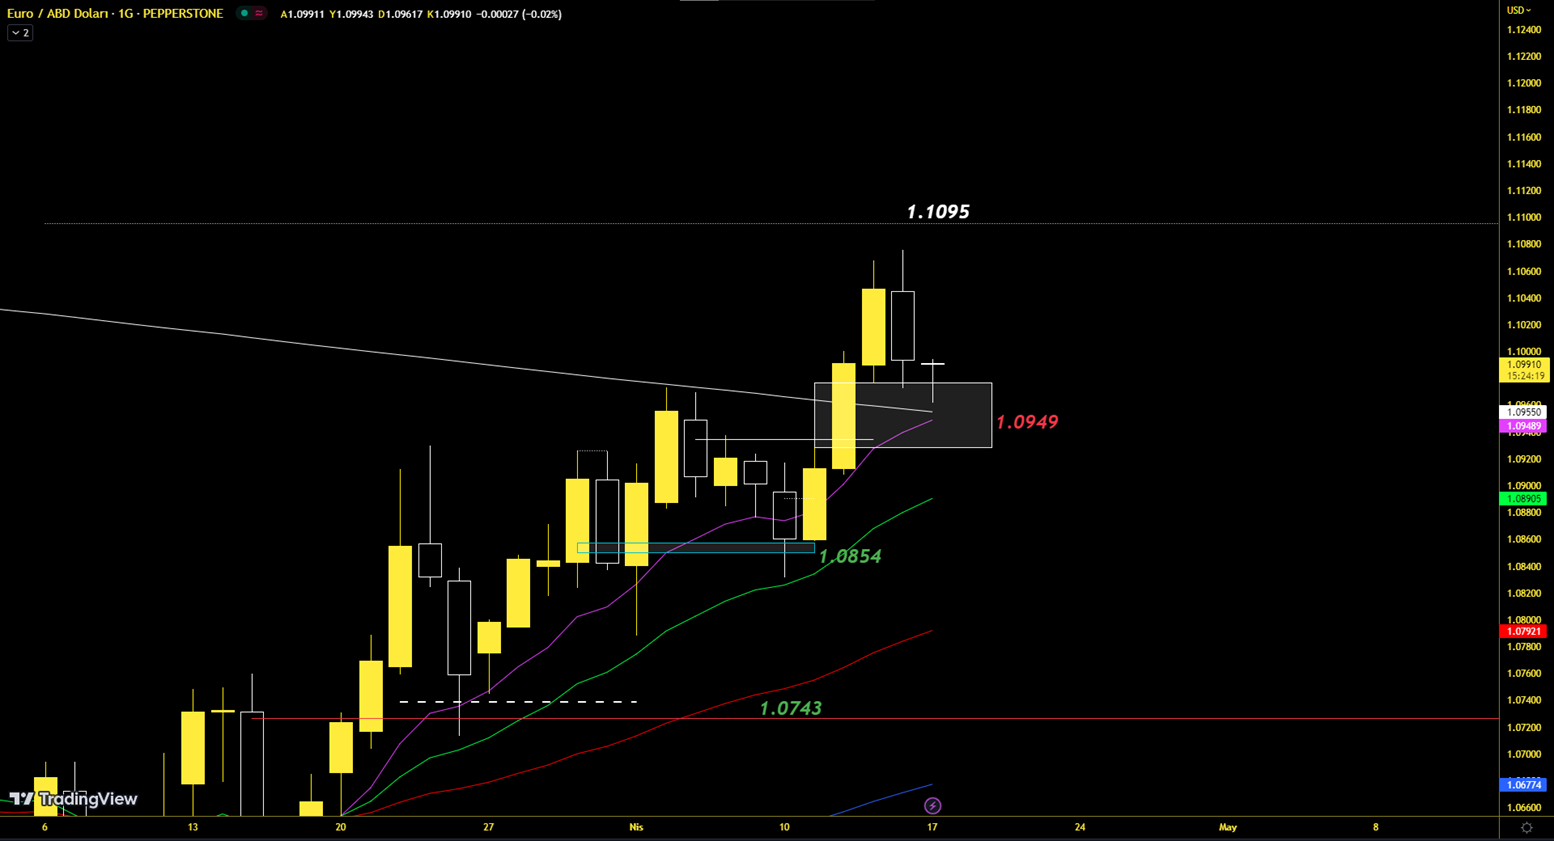
EURUSD pair entered the imbalance zone on the daily. The area indicated by the white borders on the chart is the demand area. As long as the price stays above thi...
Read More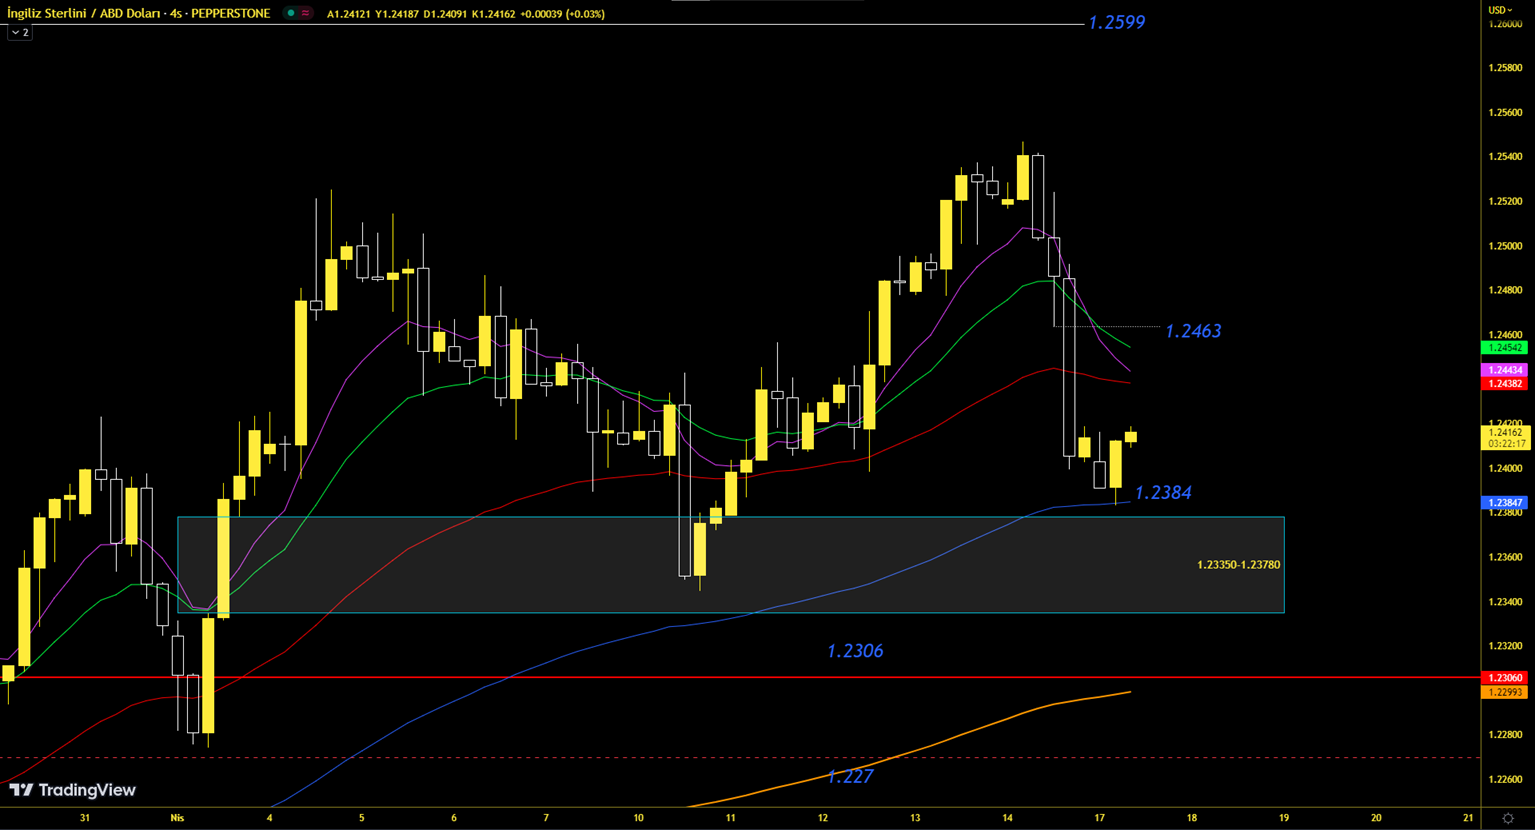
GBPUSD parity held on 4-Hour EMA100 average. This average is shown in blue on the chart. The limit of the imbalance on the upper side corresponds to the level...
Read More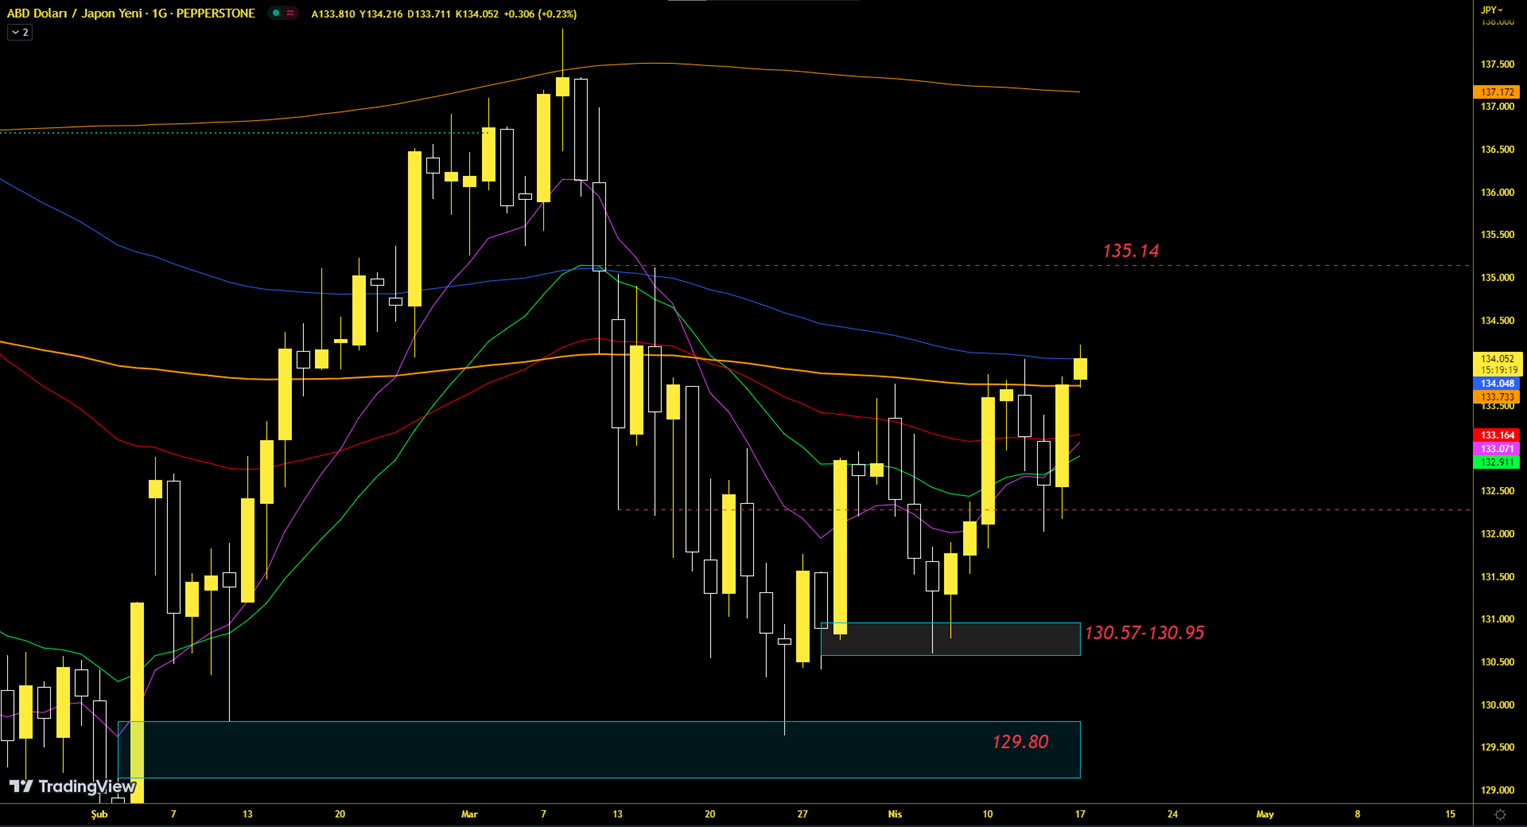
USDJPY has broken through the 200-day exponential average area, where it was previously subject to a sharp sell-off. If the price makes a strong close above 1...
Read More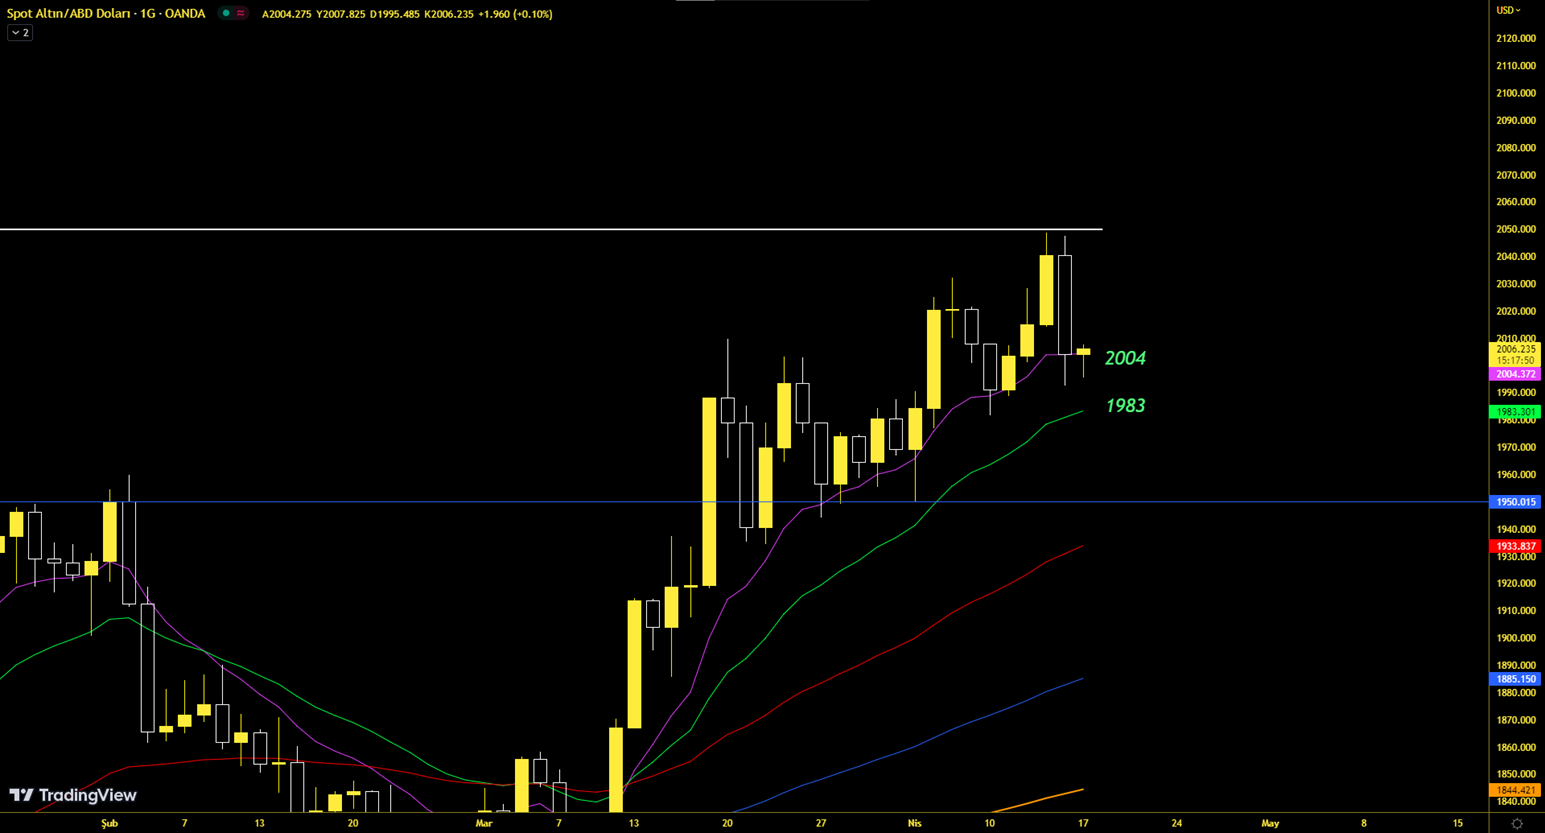
On the ounce gold side, the daily period rise structure has not yet been completely broken. Daily average supports correspond to the 2004 and 1983 dollar leve...
Read More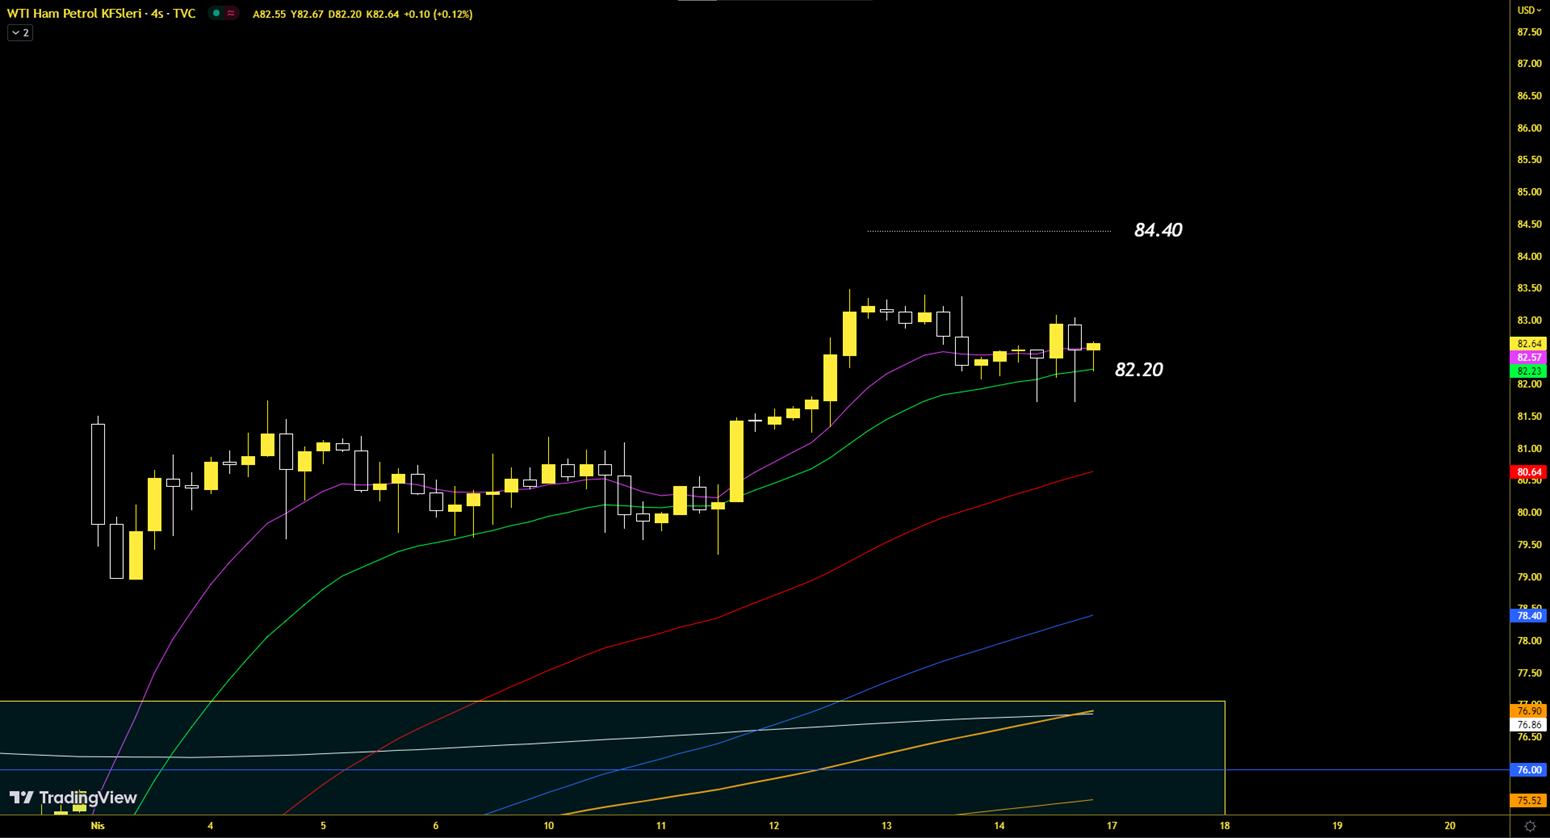
WTI Crude Oil maintains its structure in 4-Hour. It is observed to be holding above the 20-period average. It will maintain its strength above 82.20. It is p...
Read More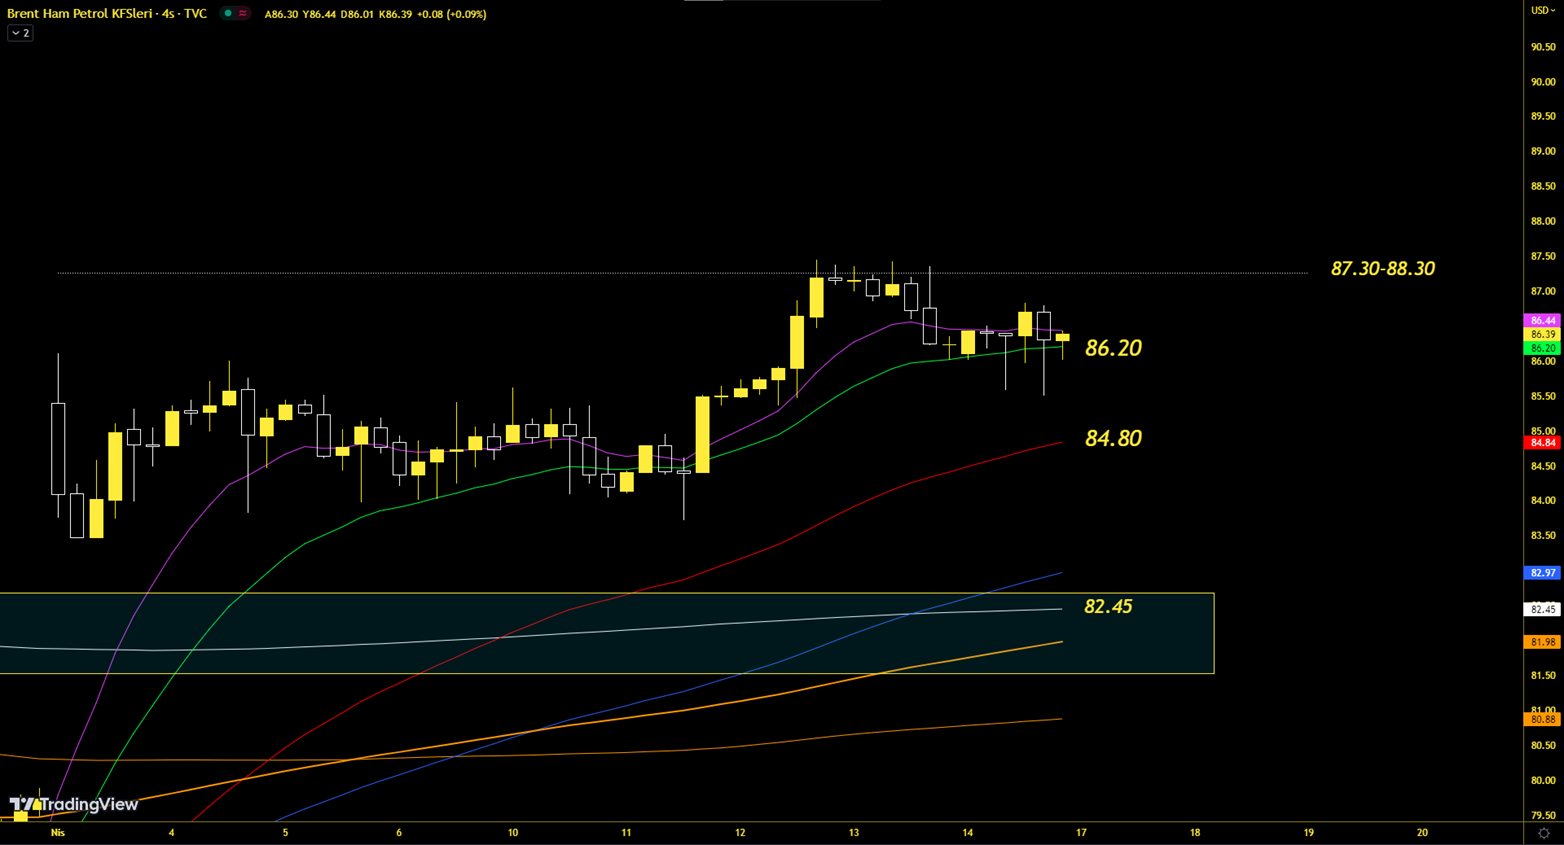
BRENT Oil is trading above the 4-hour moving average support. The price's upward momentum will be maintained above 86.20. 87.30 level can be followed as a m...
Read More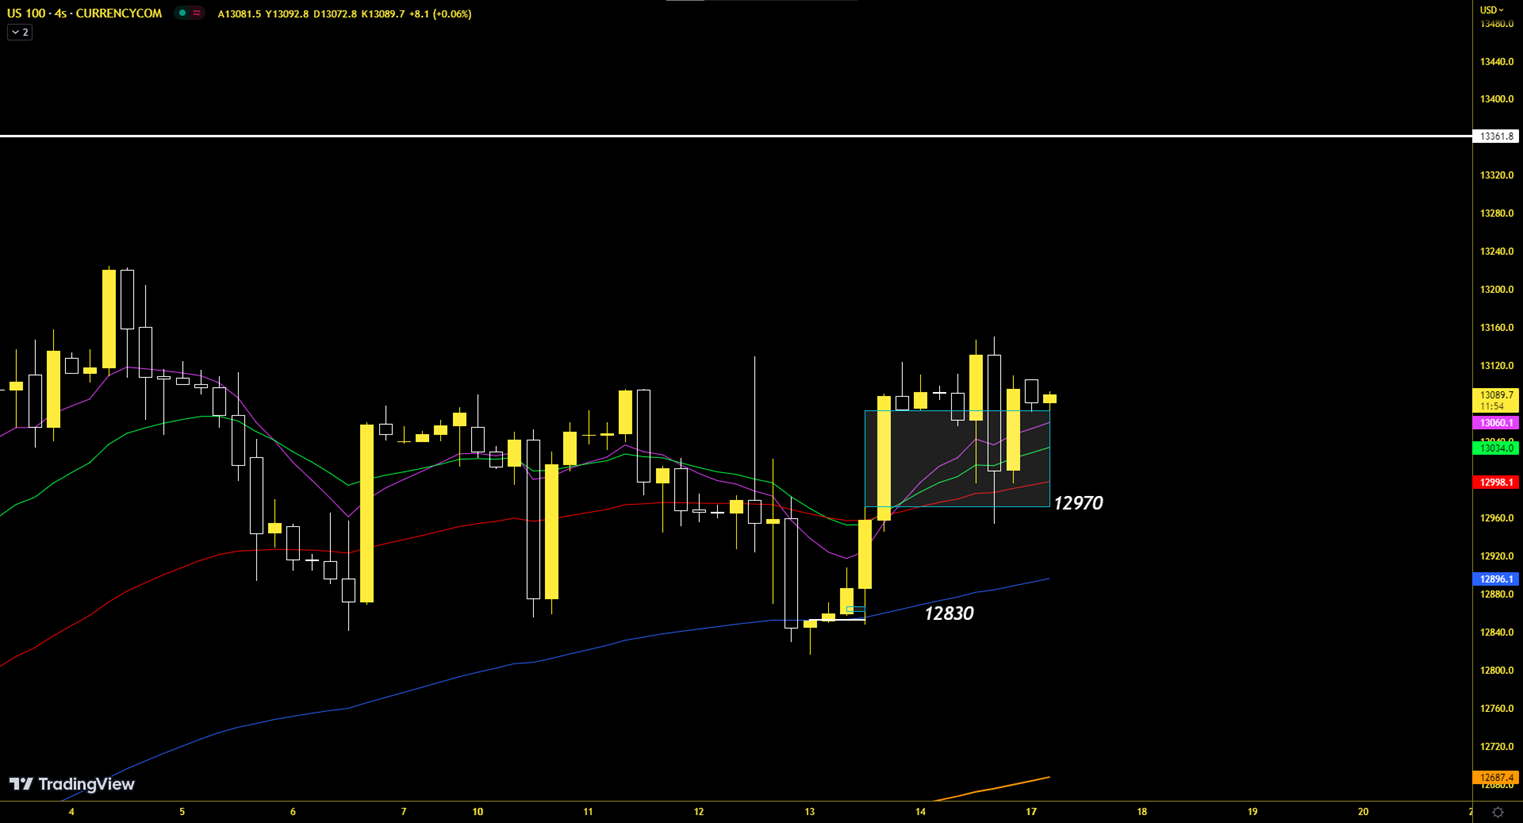
Nasdaq 4-Hour imbalance continues to remain above the demand zone. As long as this holding continues, we will expect the bullish scenario to continue in the i...
Read More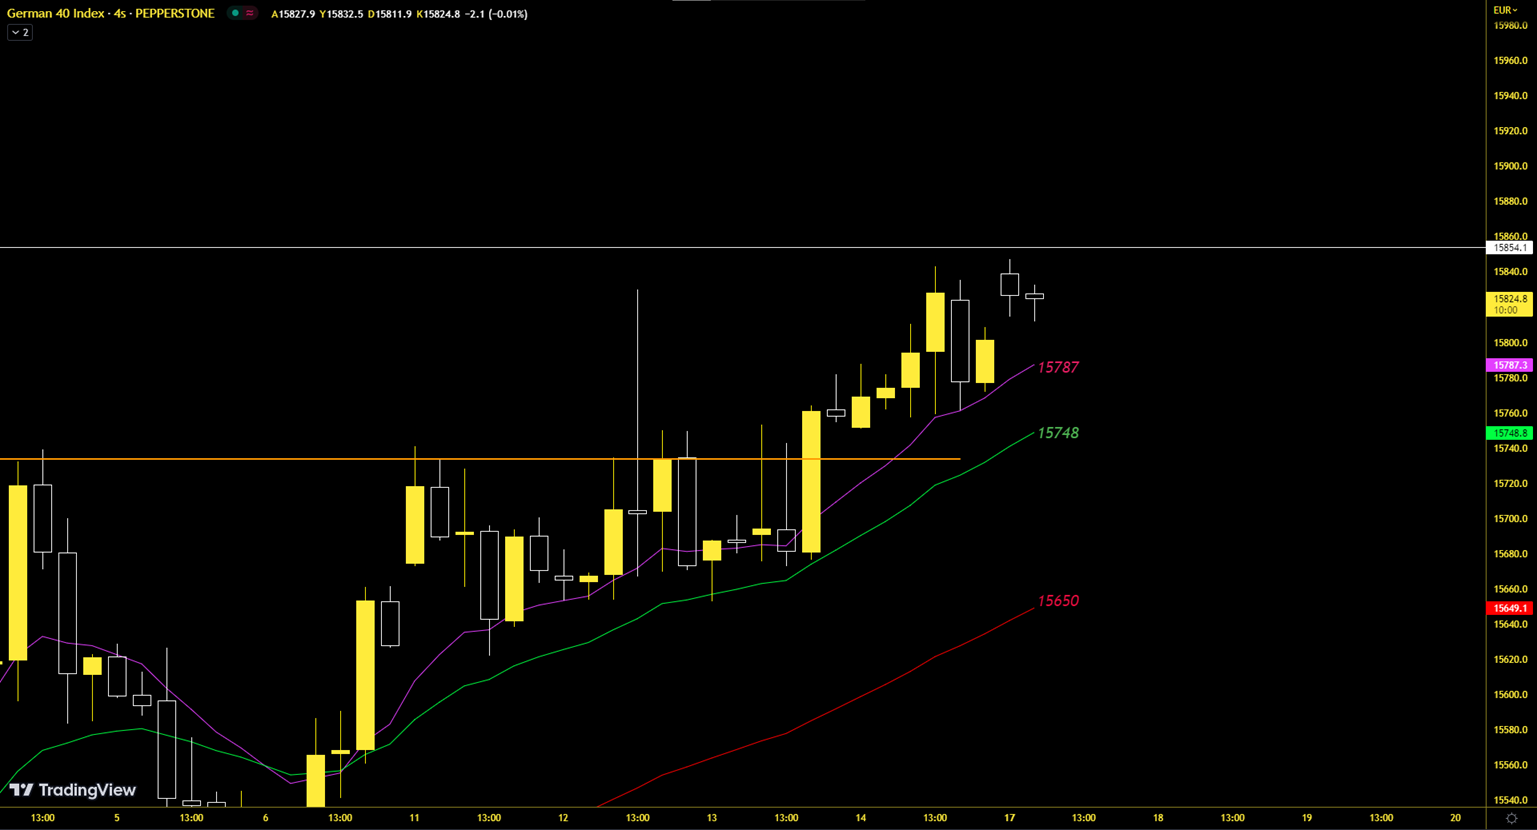
DAX continues to move above moving averages. We have not closed below EMA10 and EMA20 averages in the 4-hour period. 15787 and 15748 levels can be followed as...
Read More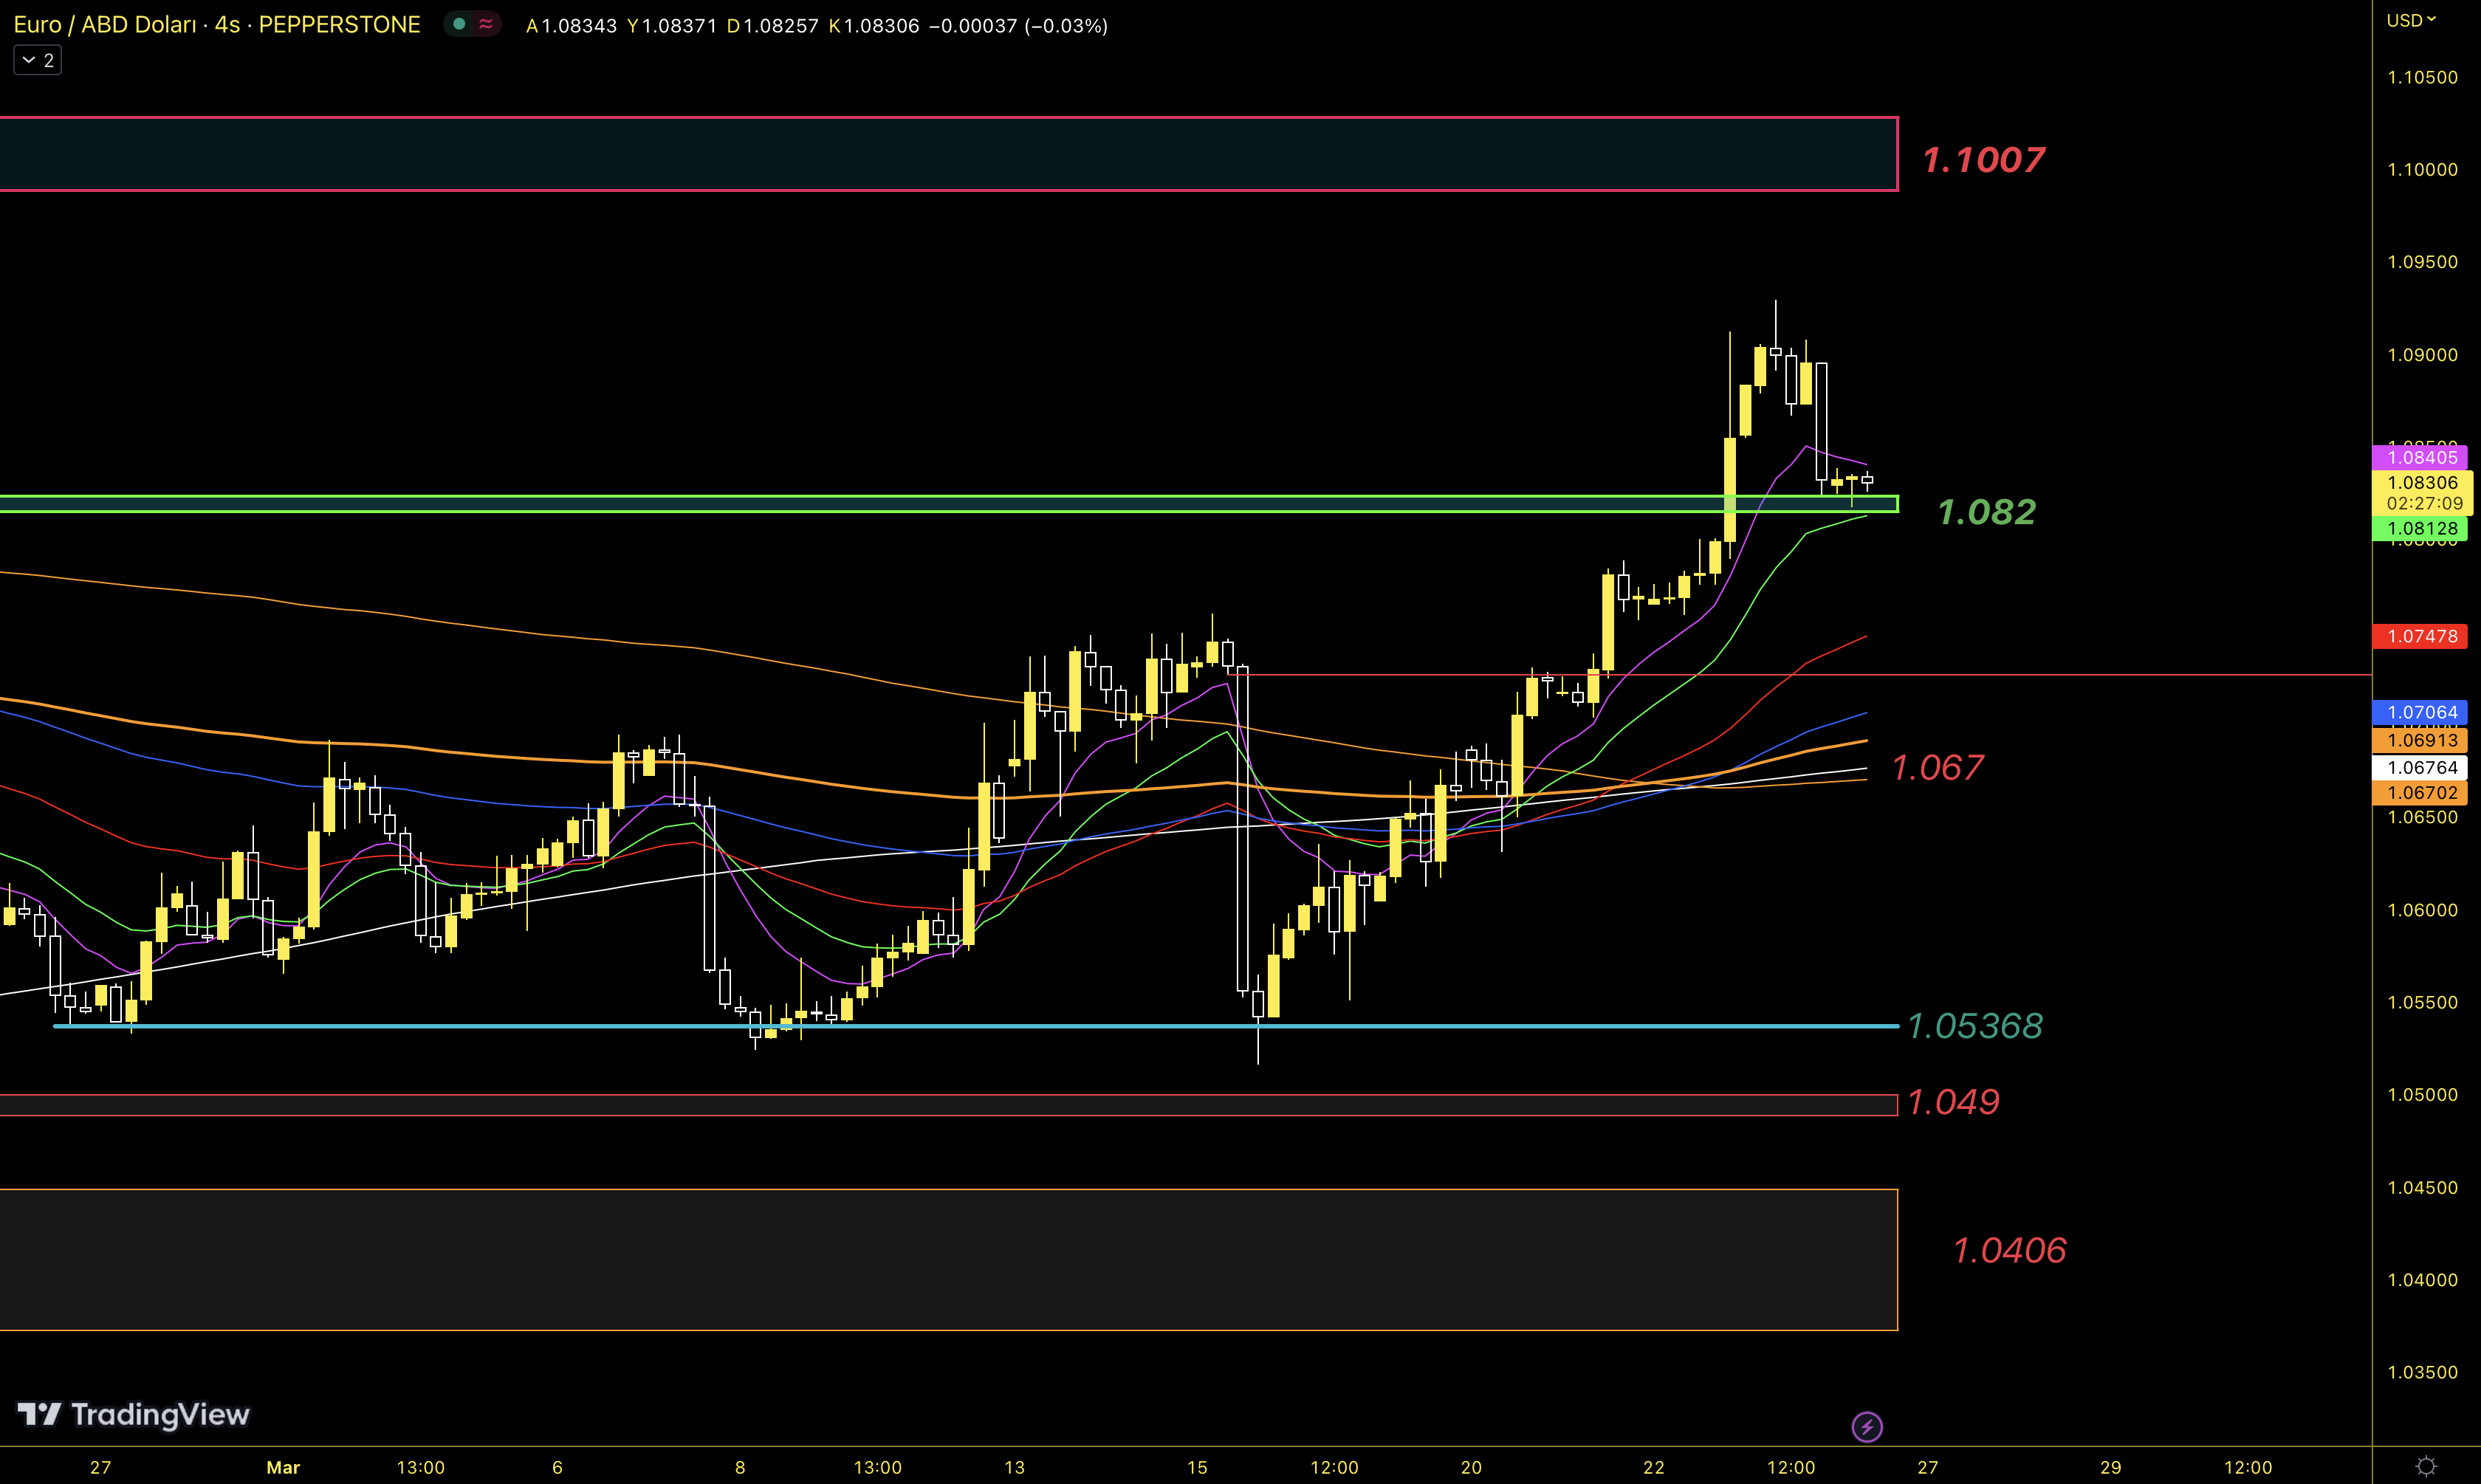
EURUSD parity has tested the 1.082 level, which we determined as an important level. There is also a 4-Hour EMA20 average just below this green horizontal zon...
Read More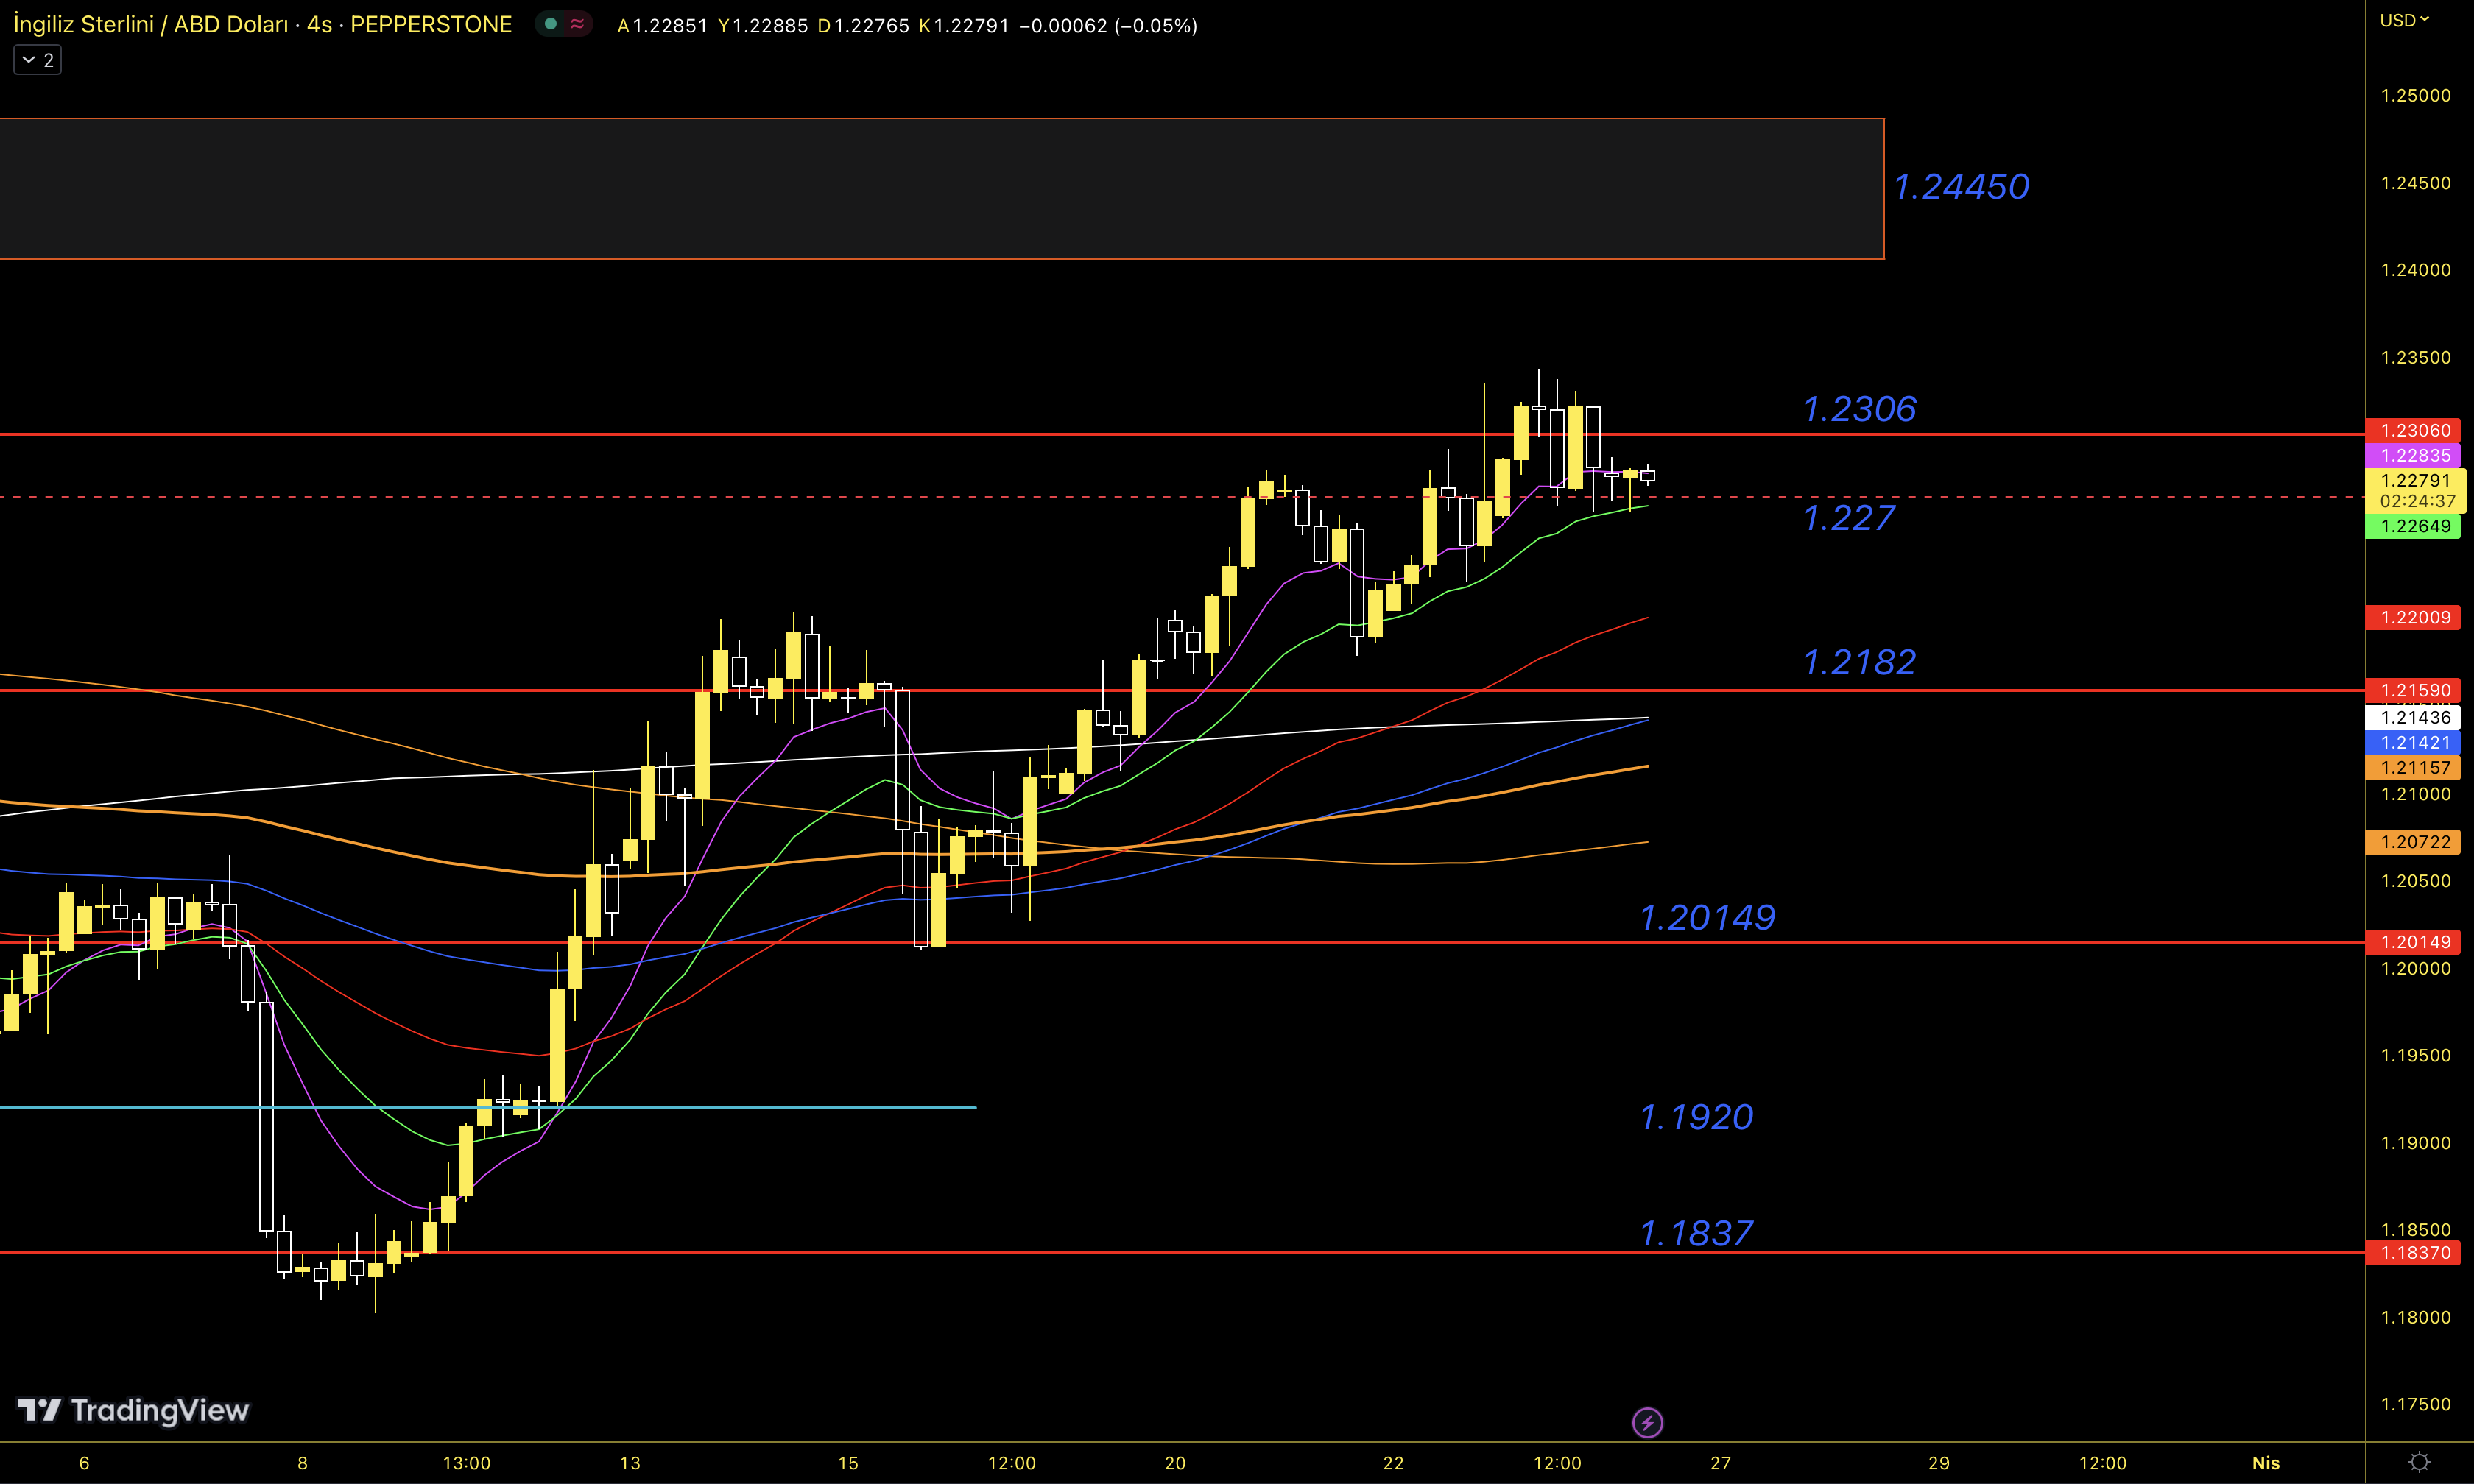
After our target of 1.2306 was seen in the GBPUSD parity, we witnessed a correction movement. The fact that the price is still holding above EMA20 in the 4-Ho...
Read More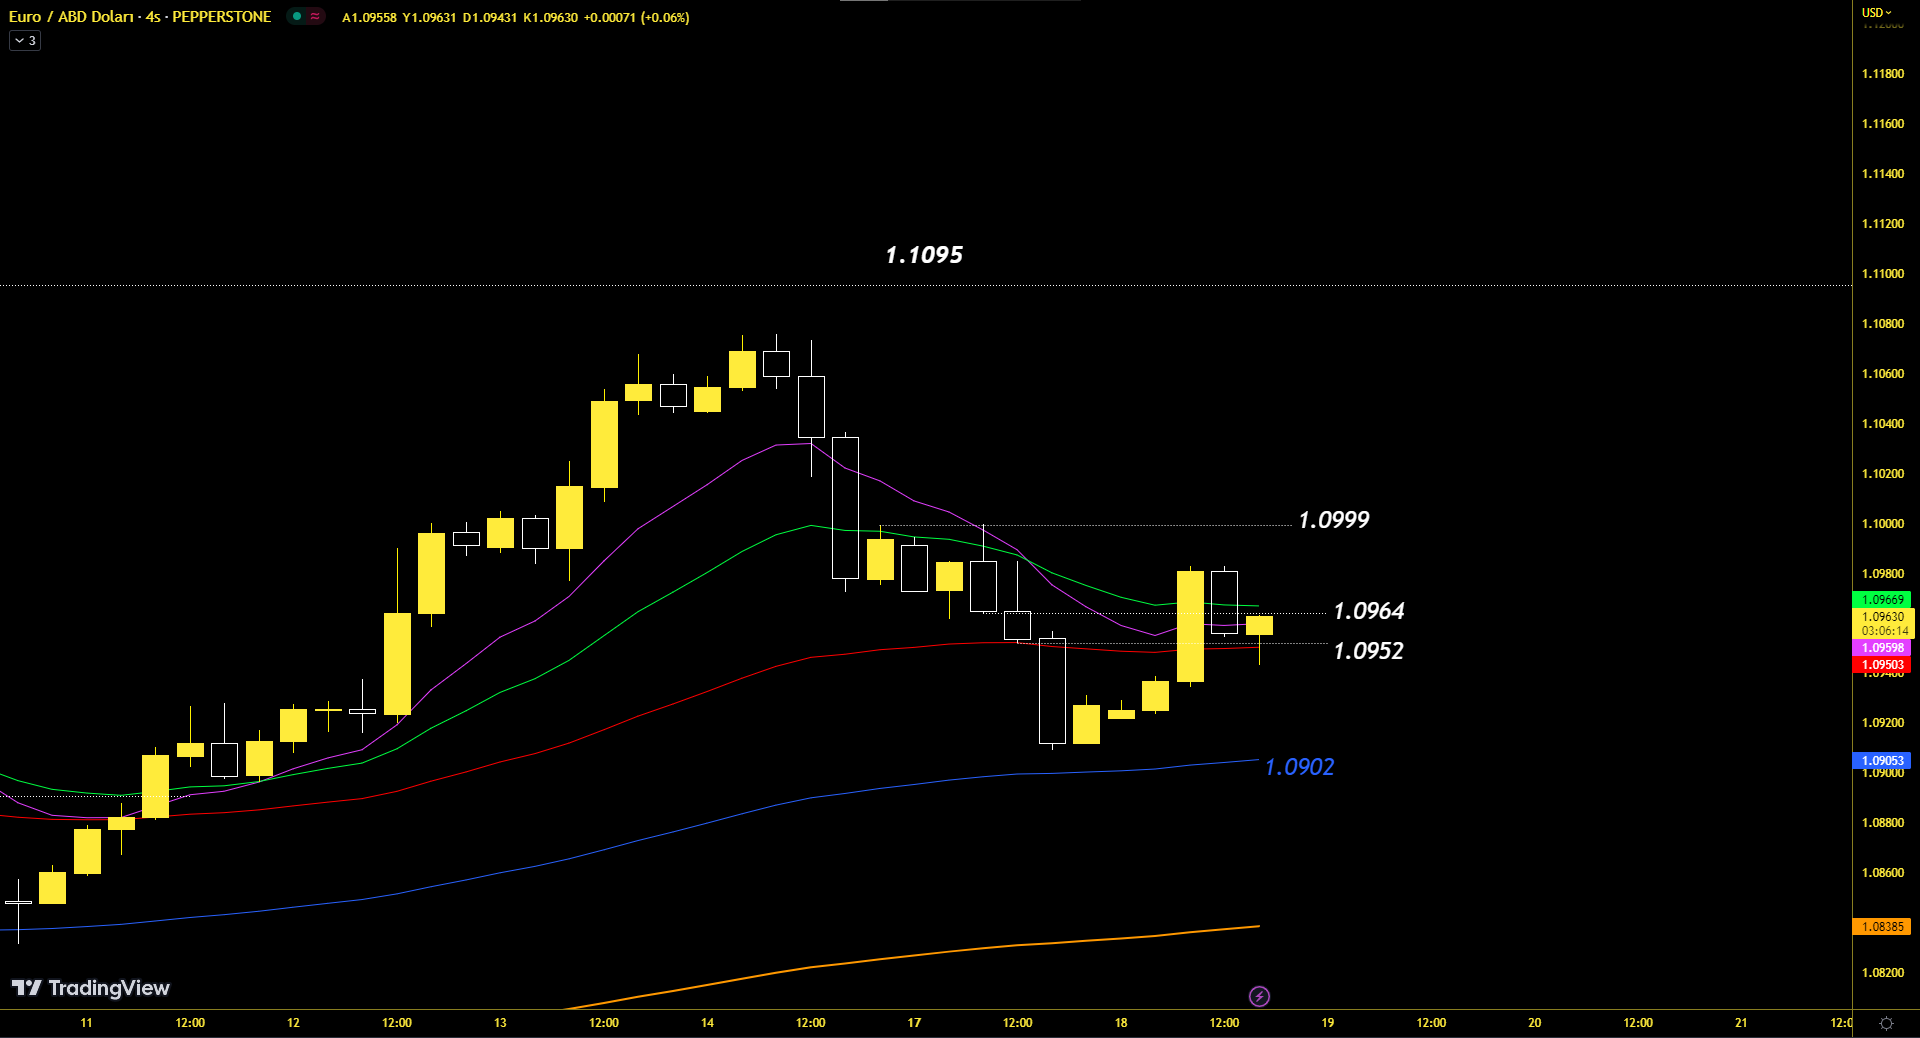
EURUSD parity has experienced sharp pullbacks since yesterday. The inner region of the imbalance in the daily time frame has been completely filled. The possi...
Read More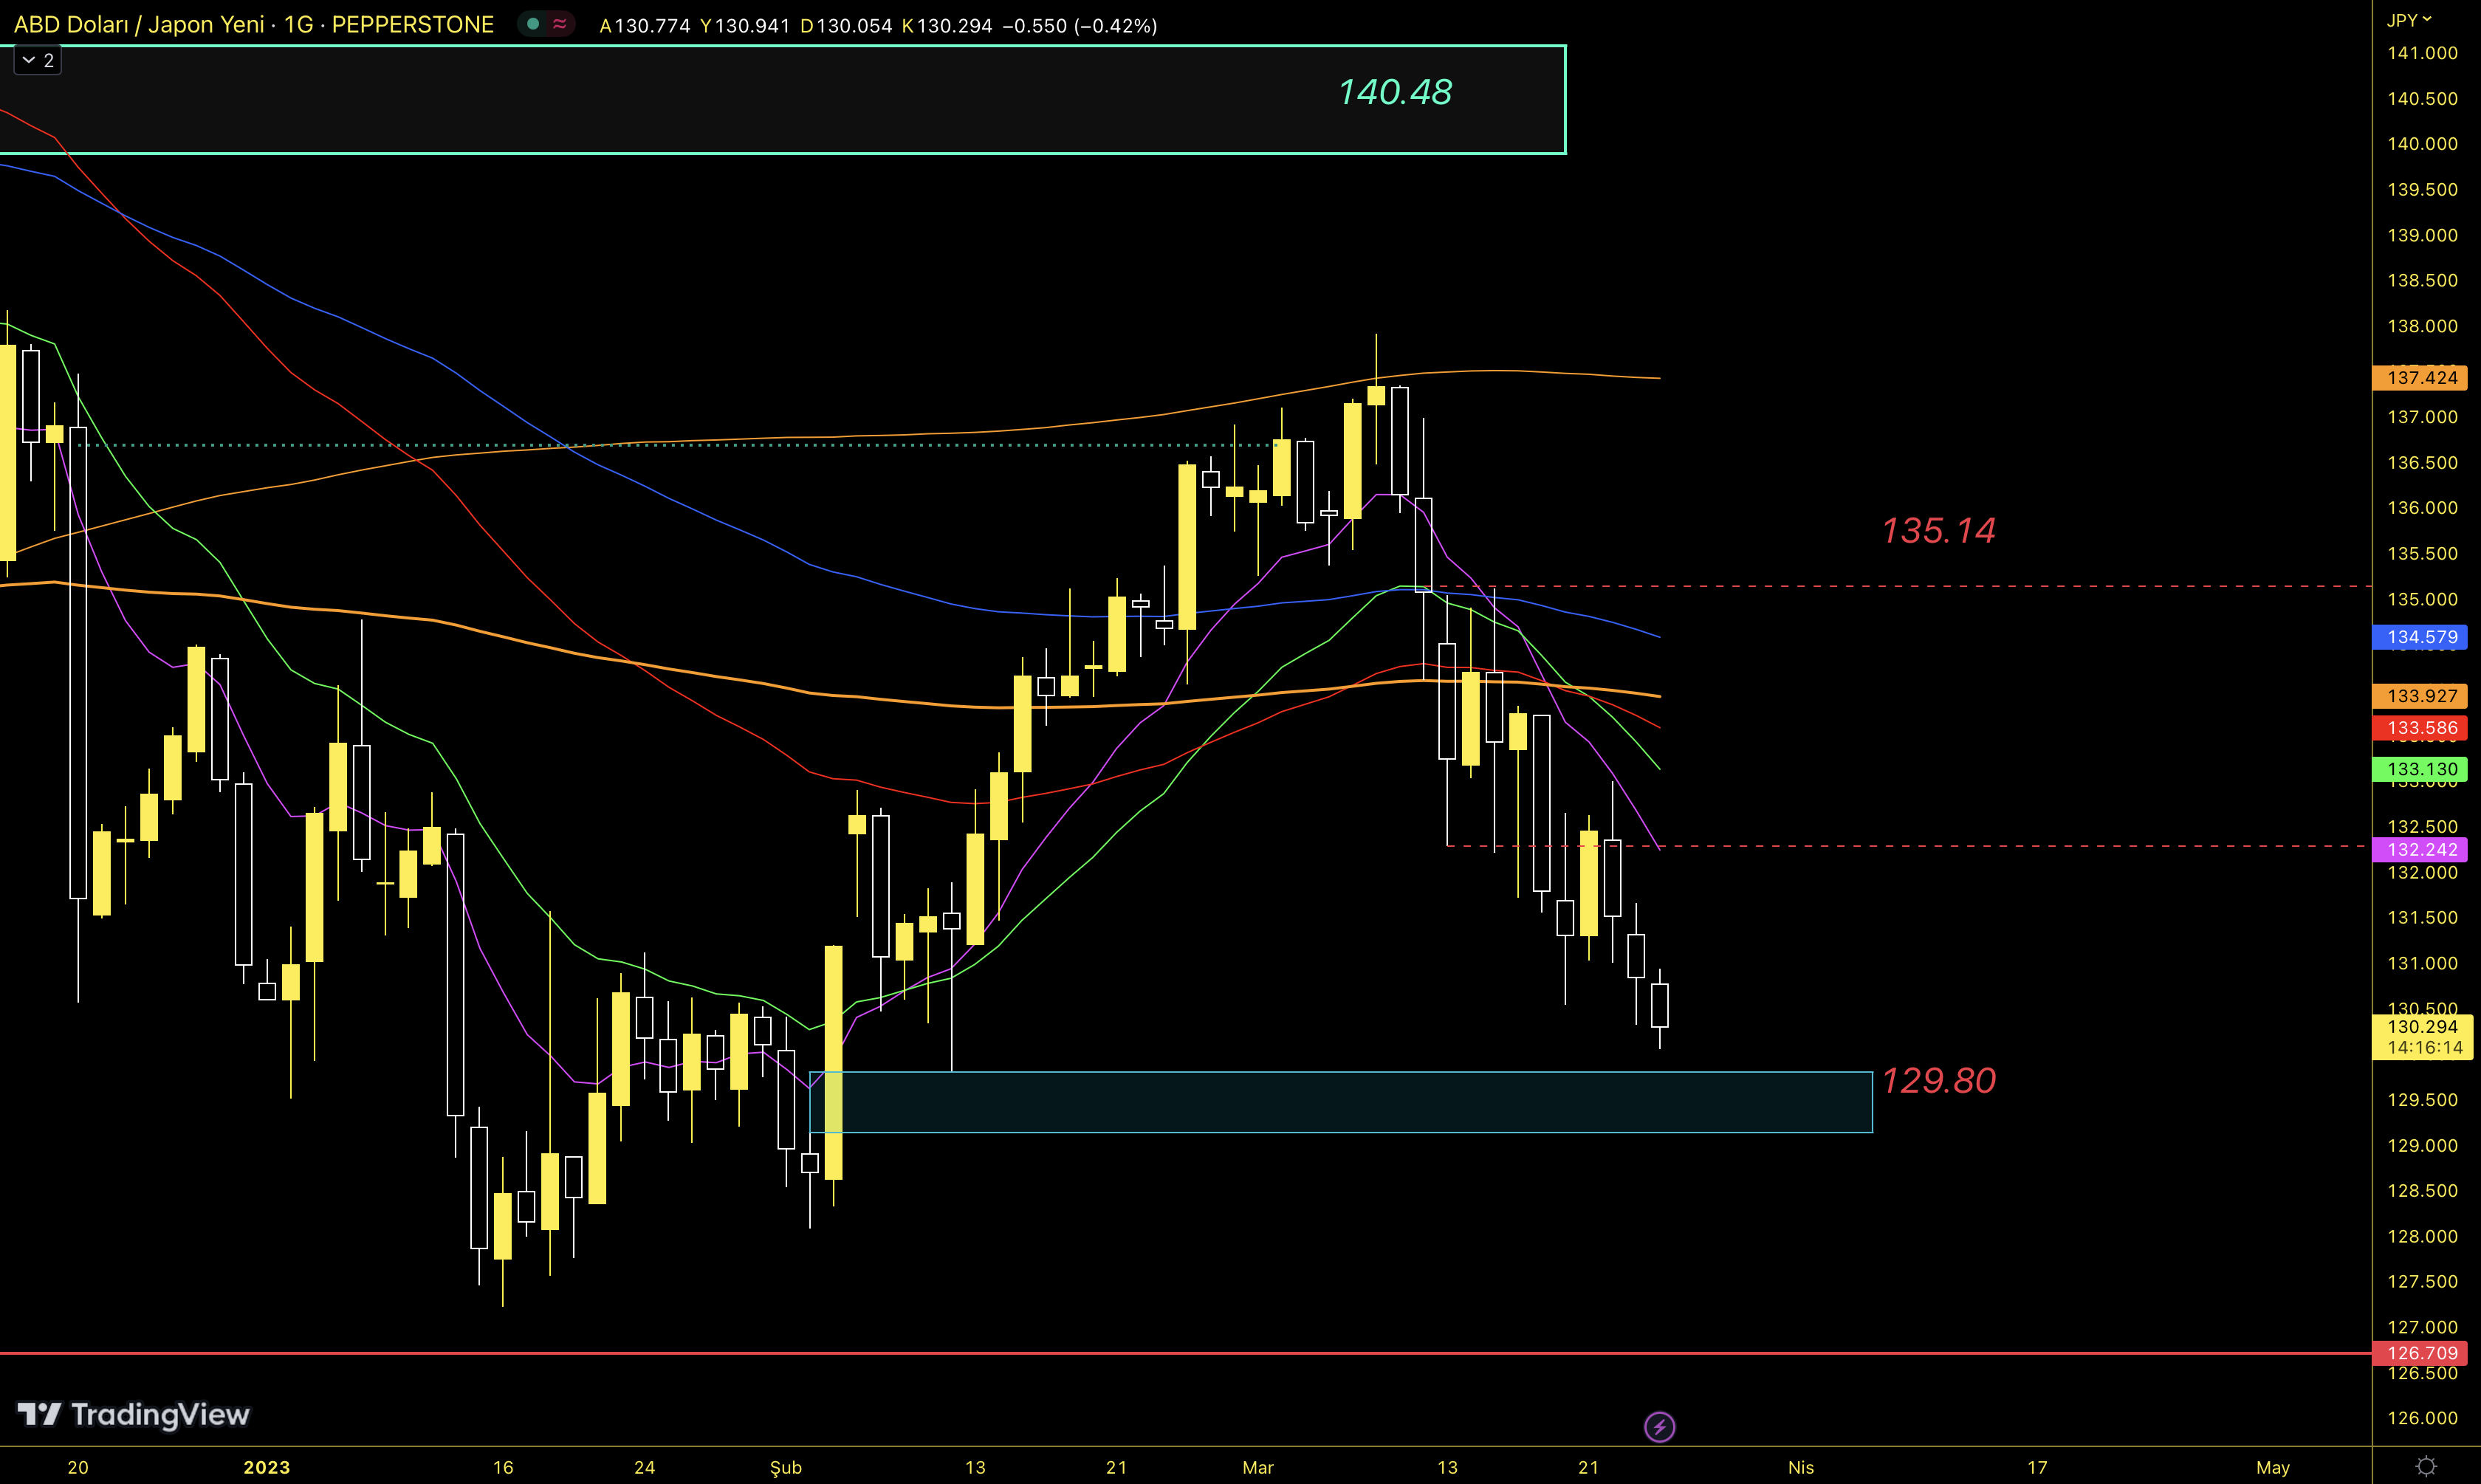
USDJPY has exhausted its upward momentum along with the loss of strength in the dollar index. The price had already lost the 200-day exponential average deman...
Read More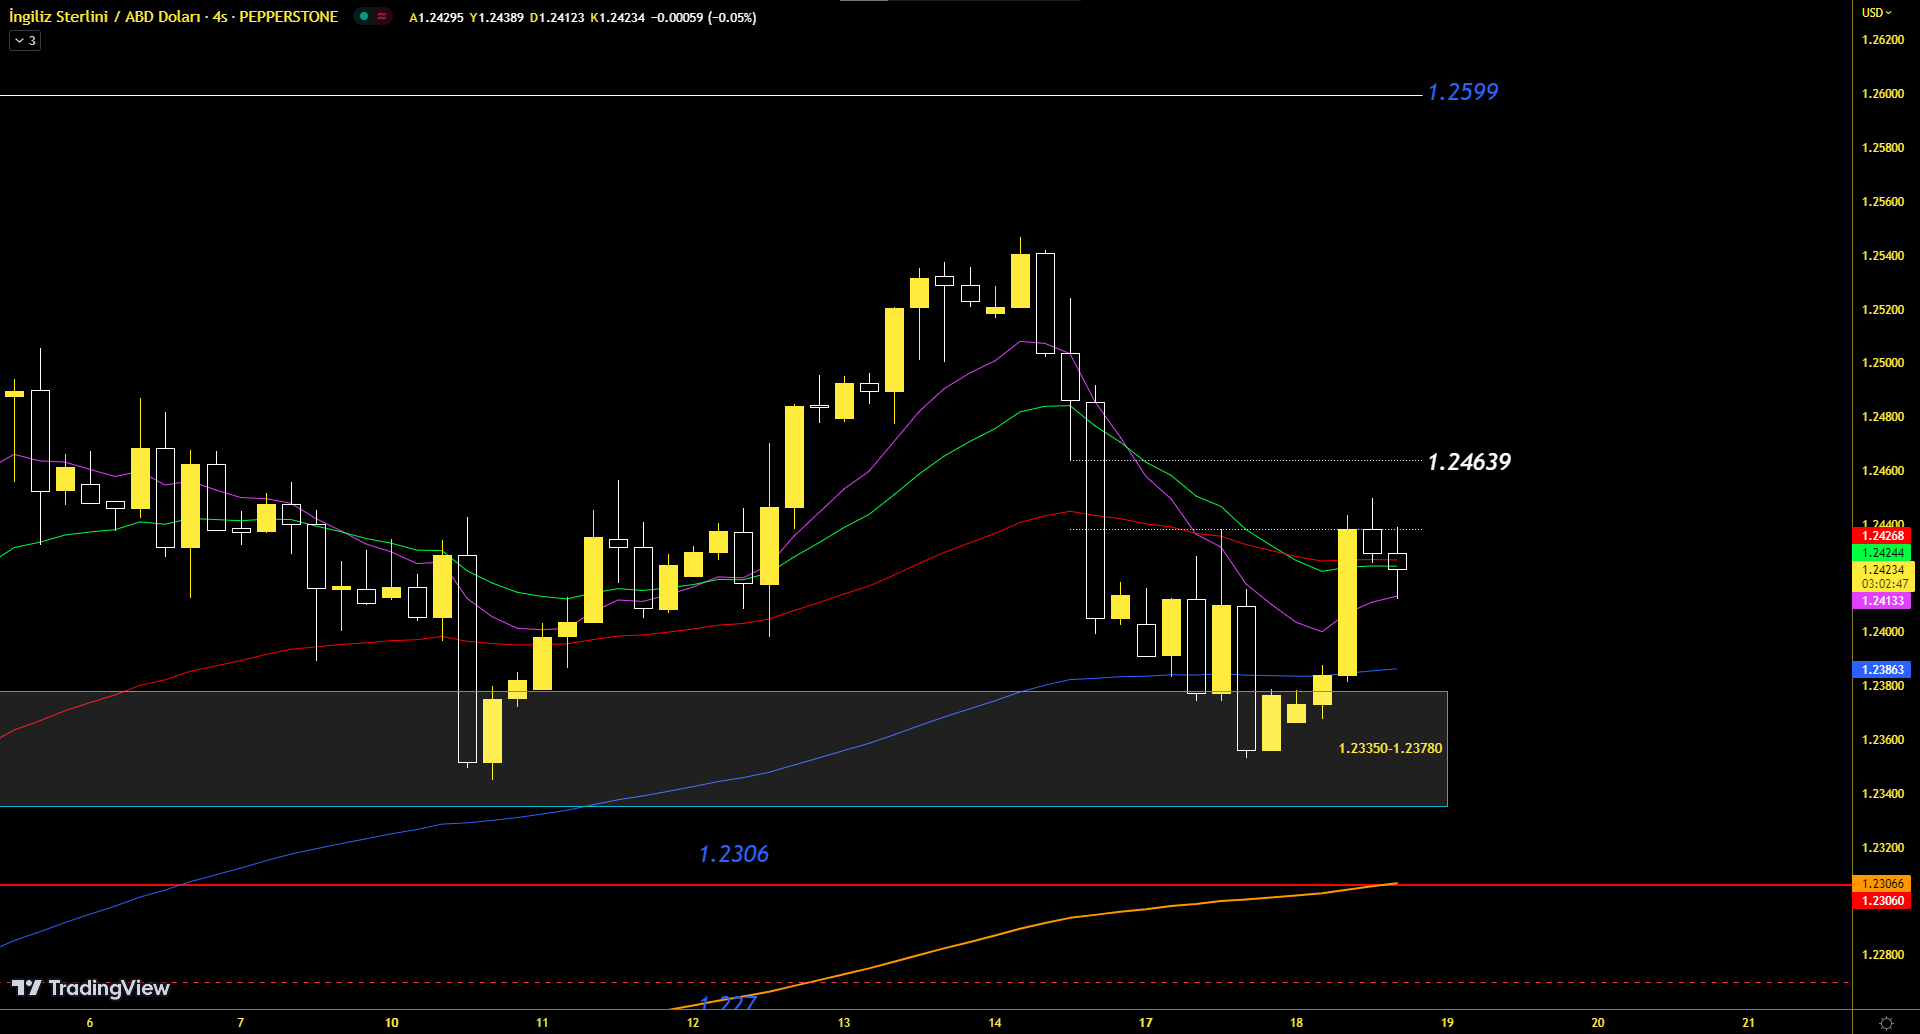
GBPUSD parity was pulled to the box area we specified as the demand zone and the price tried to hold on at this point. It seems likely that the price will tou...
Read MoreYou can use our contact form or contact information for your questions and suggestions.
Contact Us!